Dashboard
The Dashboard is the default landing page after login. It provides a real-time operational view of the security environment: alert volumes, data source health, severity trends, and correlation status — all in a single pane.
Navigation: Monitor → Overview
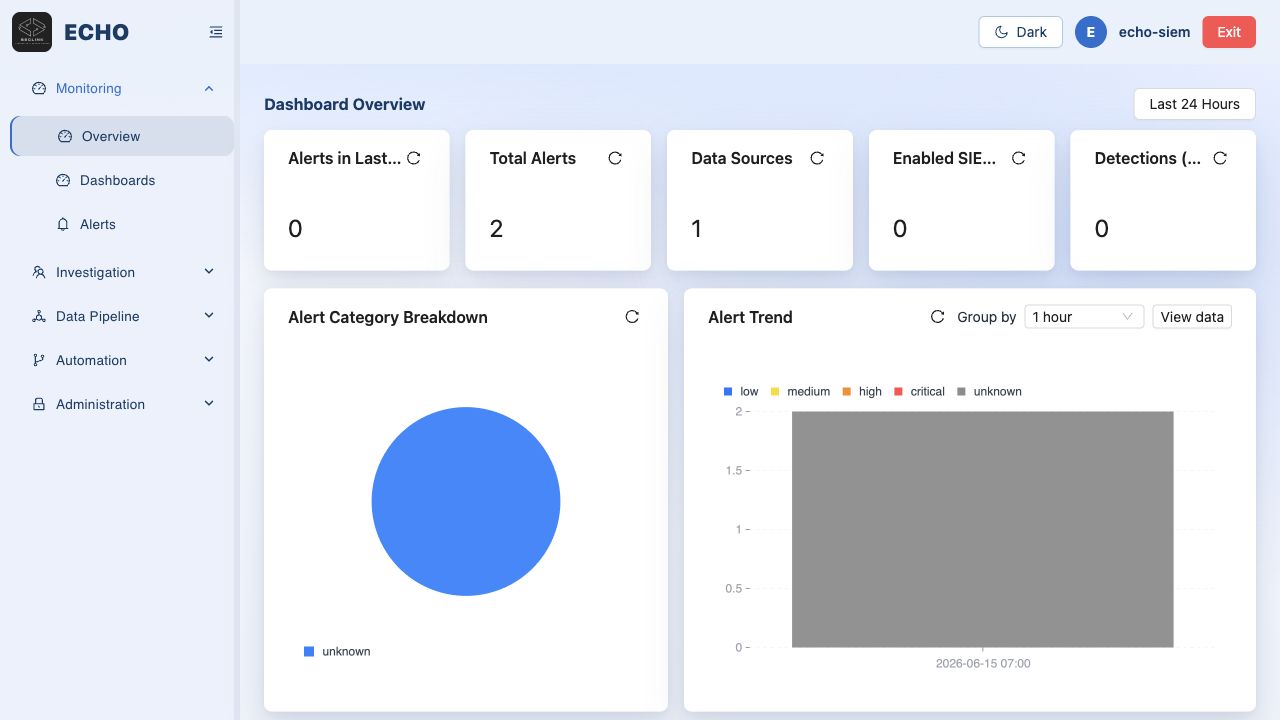
Statistics Cards
The top of the dashboard displays the following summary counters:
| Card | Description |
|---|---|
| Alerts in 15 min | Alerts ingested in the last 15 minutes |
| Alerts in 1 h | Alerts ingested in the last hour |
| Alerts in 24 h | Alerts ingested in the last 24 hours |
| Alerts in 7 days | Alerts ingested over the last 7 days |
| Total Alerts | Cumulative alert count since system initialization |
| Data Sources | Number of configured and active data source integrations |
If all counters show zero after login, no data source has been connected yet. Go to Data Onboarding to configure your first integration.
Alert Trend Chart
Below the summary cards, a time-series chart displays alert ingestion volume over a configurable window. Use this to:
- Identify ingestion spikes correlated with security events
- Confirm that the Orchestrator cron job is running on schedule
- Detect data source outages (flat line when alerts normally arrive continuously)
Severity Distribution
A breakdown chart shows the proportion of ingested alerts by severity level:
| Severity | Typical Color |
|---|---|
| Critical | Red |
| High | Orange |
| Medium | Yellow |
| Low | Blue / Gray |
Monitoring severity distribution over time helps detect detection drift — for example, a sudden increase in Critical alerts may indicate a new active threat or a misconfigured detection rule generating false positives.
Navigation Structure
The left sidebar organizes the platform into functional areas:
| Area | Modules |
|---|---|
| Monitor | Overview (Dashboard), Alerts |
| Investigation | Tickets |
| Data Pipeline | Integrations, Orchestrator, Correlation, Detection |
| Settings | Workflows, Administration |
Initial State
On a fresh installation with no data sources configured:
- All alert counters will read
0 - The trend chart will be empty
- Data Sources will show
0
Recommended first steps:
- Go to Data Onboarding → configure an Elasticsearch integration
- Set up an Orchestrator task to begin ingesting alerts
- Configure a Correlation policy to generate tickets from incoming alerts
- Return to Dashboard to confirm data is flowing
Refreshing Data
The Dashboard auto-refreshes periodically. To force a manual refresh, reload the page. Alert statistics reflect data already written to the internal database — newly ingested alerts appear after the next Orchestrator run completes.