Ticket Handling
The Tickets module is the core incident management component of Argus. It provides a full lifecycle system for tracking security incidents from creation through resolution, with built-in SLA monitoring, AI-assisted analysis, collaborative investigation, and a SOAR workflow engine.
Tickets
Navigation
Click Tickets in the left sidebar to open the Tickets module.
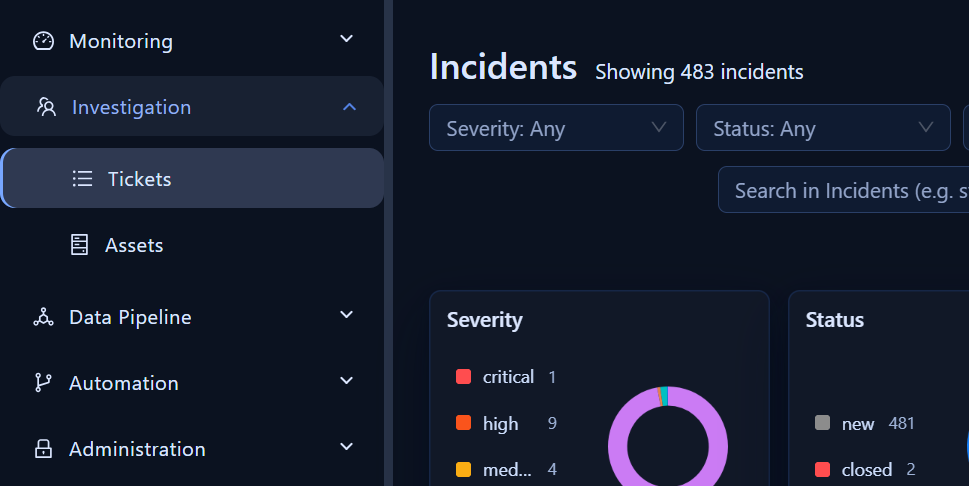
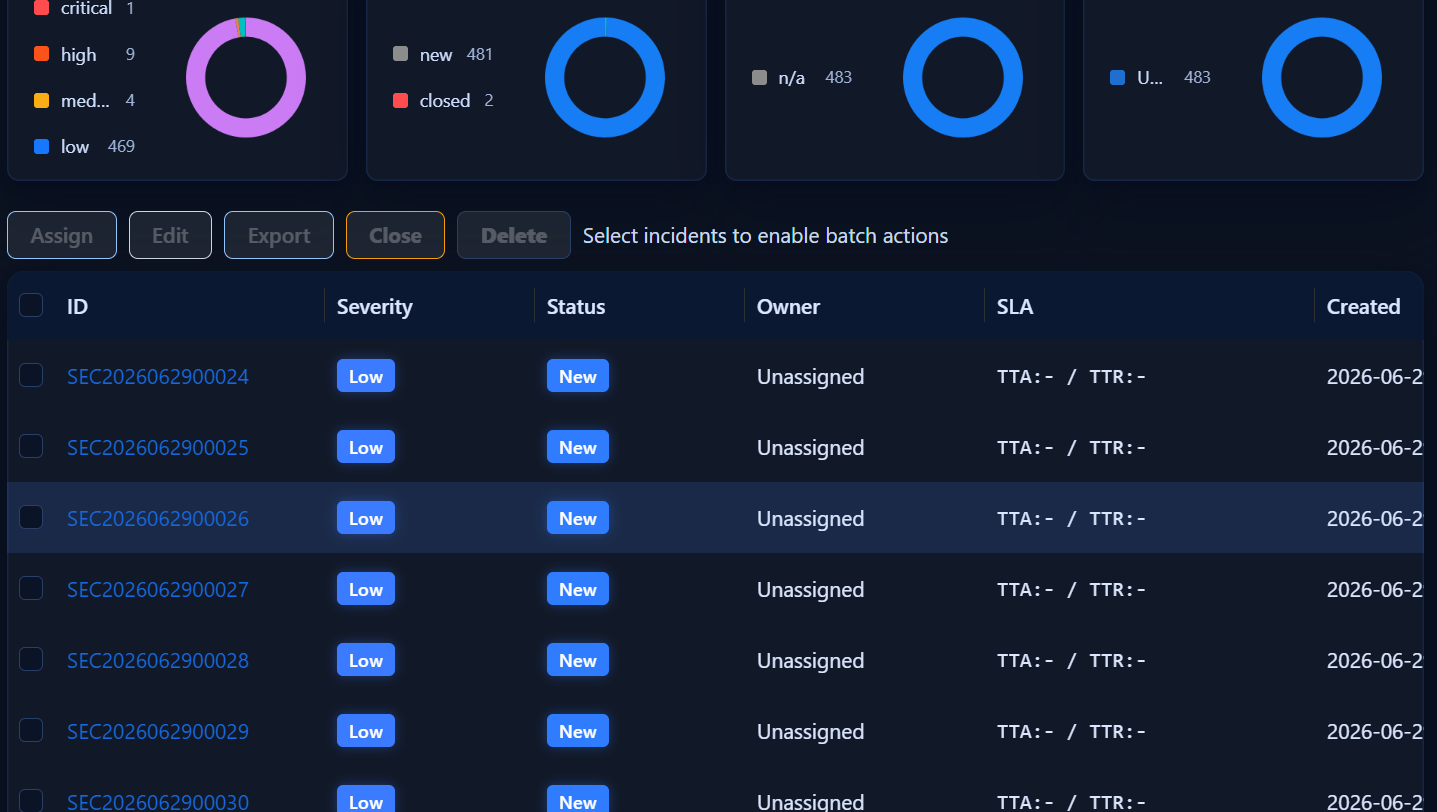
Ticket List View
The list provides a unified view of all active incidents with filtering, sorting, and chart visualization.
Key Features
| Feature | Description |
|---|---|
| Search Bar | Free-text search across ticket number, title, status, priority, and owner. Supports structured queries: status:new priority:high owner:admin |
| Time Range Filter | Quick presets (15m, 1h, 24h, 7d, 30d) or custom date range |
| Chart Panel | Visual breakdown by severity, status, and SLA compliance |
| Auto-Refresh | Configurable intervals (1m, 5m, 10m) |
| Multi-Select Filters | Filter by severity, status, owner, and SLA bucket |
| View Modes | Toggle between Table and Summary views |
Table Columns
| Column | Description |
|---|---|
| Ticket Number | Unique identifier (SEC20260702NNNNN) |
| Title | Short incident summary |
| Priority | Critical / High / Medium / Low |
| Status | Current lifecycle state (color-coded) |
| Owner | Assigned analyst |
| Created | Creation timestamp |
| SLA | MTTR bucket: <=1h / 1–4h / >4h |
Creating a Ticket
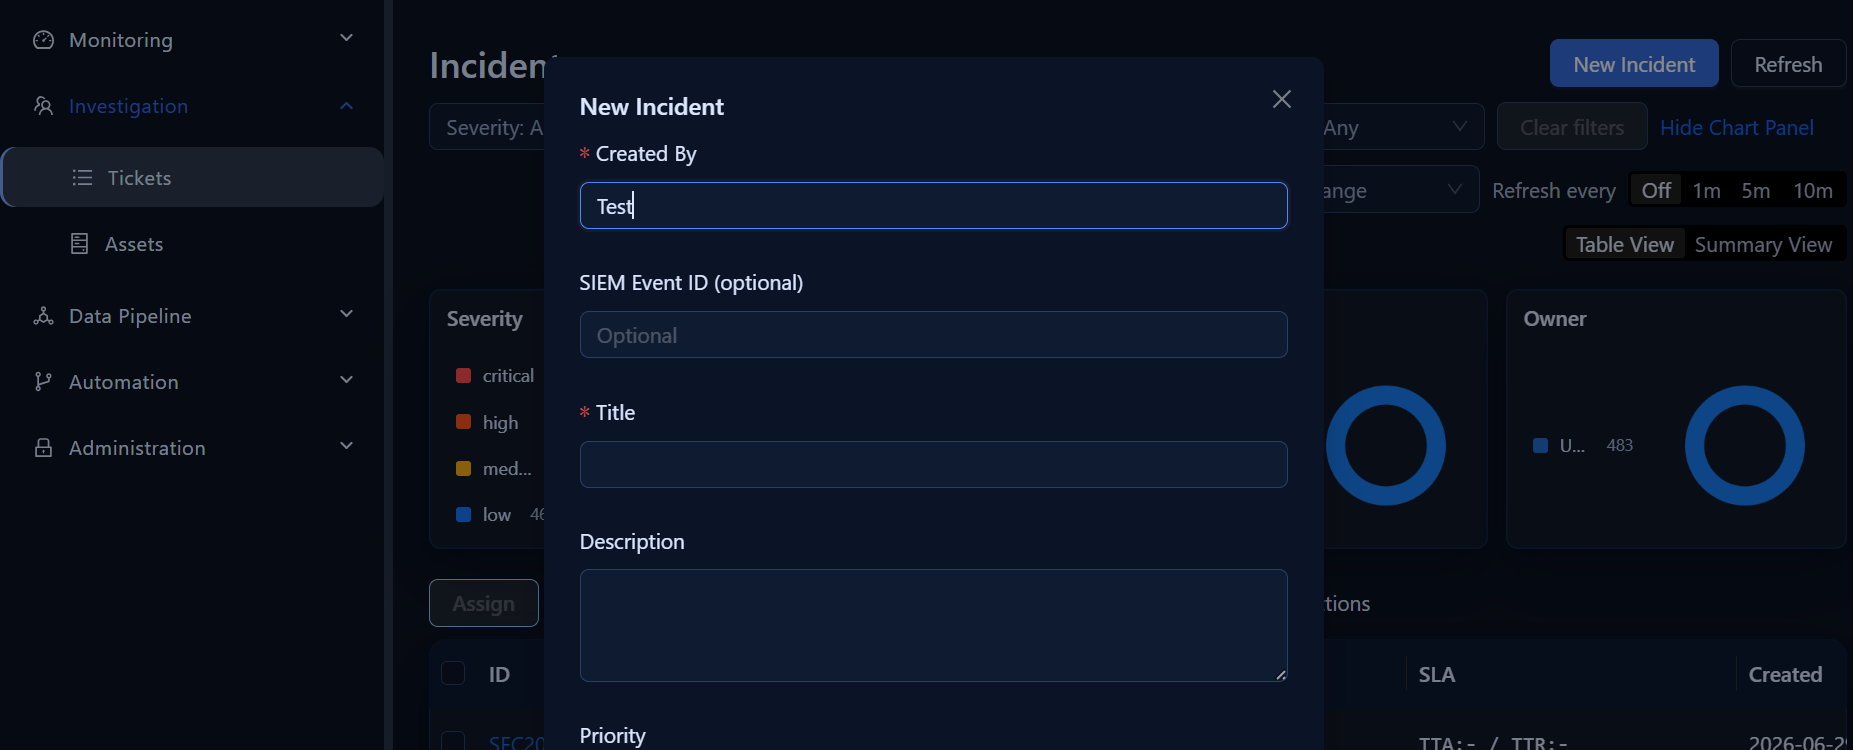
- Click Create Ticket in the top-right of the list.
- Fill in required fields:
- Title — brief incident summary
- Priority — Critical, High, Medium, or Low
- Description — detailed incident description
- Assigned User — responsible analyst
- Fill in optional fields as needed:
- Event Category — e.g., Malware, Denial of Service, Account Anomalies
- Event Sources — SIEM, EDR, Firewall
- Event Platform — Windows, Linux, AWS
- Labels — key-value pairs for categorization and automation
- Click Submit.
The system generates a unique ticket number and starts SLA tracking automatically.
Ticket Detail View
Click any ticket row to open the detail view.
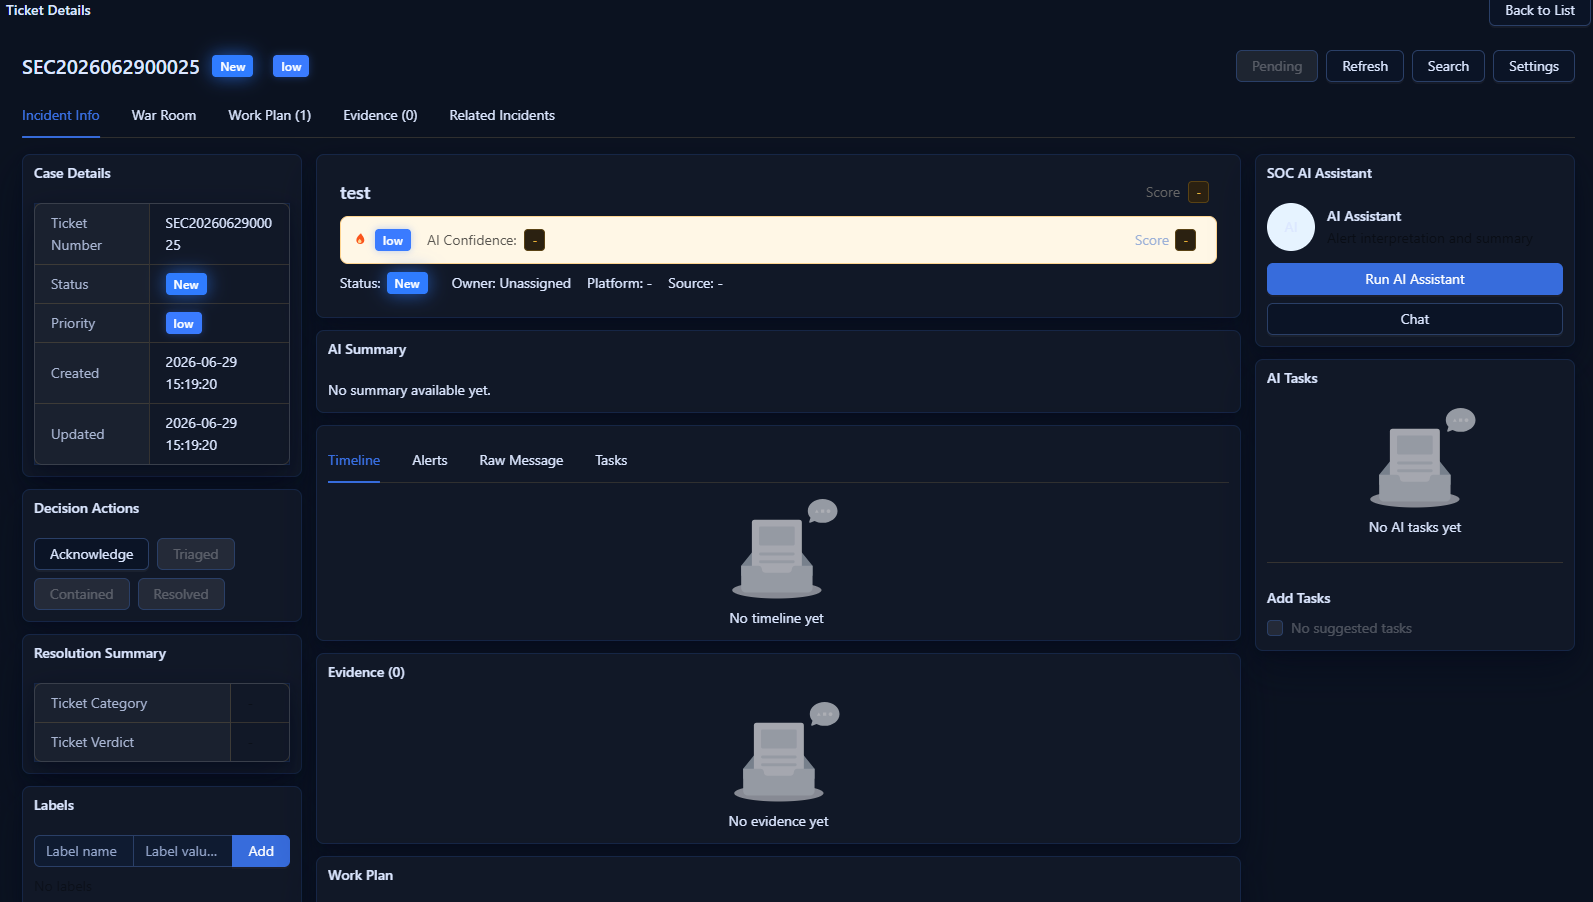
Tabs
| Tab | Contents |
|---|---|
| Incident | Timeline, AI assistant panel, decision bar, case details, labels |
| War Room | Work logs, handle logs, file attachments, evidence |
| Evidence | Extracted observables (IPs, domains, hashes) |
| Raw Message | Original alert JSON with syntax highlighting |
Ticket Lifecycle
New → Acknowledged → Triaged → Contained → Resolved → Closed
| Status | Description |
|---|---|
| New | Freshly created, awaiting first response |
| Acknowledged | Analyst has begun reviewing |
| Triaged | Classified and prioritized |
| Contained | Immediate threat mitigated |
| Resolved | Root cause addressed; incident handled |
| Closed | Administratively closed |
Updating status — Option 1 (recommended): Decision buttons
Context-sensitive buttons appear at the top of the Incident tab:
- Acknowledge — available when
New - Triage — available when
Acknowledged - Contain — available when
Triaged - Resolve — available when
TriagedorContained(opens a resolve dialog)
Updating status — Option 2: Status dropdown
Use the status dropdown and click Update Status to set any valid state manually.
Resolve dialog fields:
- Event Category — root cause classification
- Event Result — True Positive / False Positive / True Positive - Benign
- Notes — resolution summary
Pending state: Toggle Pending to temporarily pause SLA timers. Pending intervals are subtracted from SLA calculations.
SLA Tracking
| Metric | Formula | Description |
|---|---|---|
| MTTA | T3 − T2 | Mean Time To Acknowledge |
| MTTI | T4 − T3 | Mean Time To Investigate |
| MTTC | T5 − T2 | Mean Time To Containment |
| MTTR | T6 − T2 | Mean Time To Resolution |
SLA buckets in the list view:
- Green
<=1h— within target - Yellow
1–4h— approaching breach - Red
>4h— SLA breached
War Room
The War Room consolidates all investigative artifacts for a ticket.
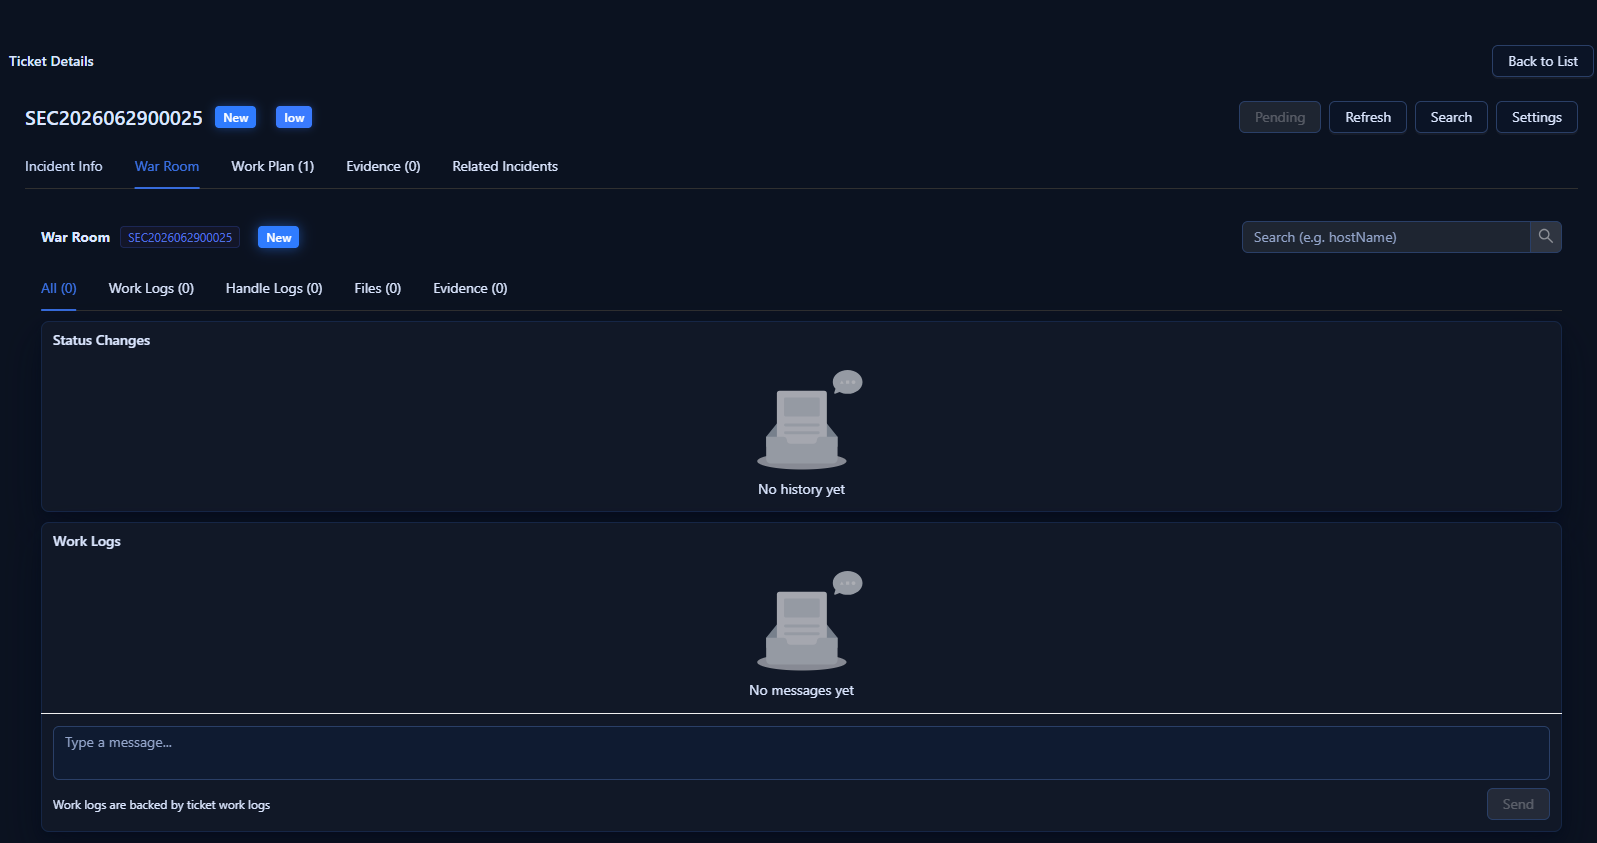
| Section | Contents |
|---|---|
| All | Combined view of work and handle logs |
| Work Logs | Analyst notes, AI responses, comments |
| Handle Logs | System entries (status changes, label updates) |
| Files | Uploaded attachments |
| Evidence | Collected observables and evidence |
Adding a work log:
- Type in the text area at the bottom.
- Paste images directly (Ctrl+V / Cmd+V) — auto-uploaded and embedded.
- Click Send.
AI Assistant
Click AI Assistant (or the lightning bolt icon) to generate:
- Alert Explanation — plain-language description
- Risk Level Recommendation — suggested severity with rationale
- Completed Tasks — actions the AI has already performed
- Next Tasks — recommended analyst follow-up
AI Chat: Click Chat to open an interactive conversation scoped to the current ticket. Chat history persists per ticket.
@ai mention: In the comment box, type @ai <question> to post an AI response directly to the work log.
@playbook mention: Type @playbook <name> to invoke a workflow playbook with the current ticket as context.
Labels and Observables
Labels are key-value pairs used for categorization and workflow automation:
- Go to the Labels section in the ticket detail.
- Click Add Label, enter name and value, click Save.
Labels can trigger automatic workflow bindings and filter tickets in the list.
Observables are extracted indicators (IPs, domains, hashes) that appear in the Evidence tab, populated by AI analysis or manual entry.
Batch Operations
Select multiple tickets with checkboxes to access batch actions:
| Action | Description |
|---|---|
| Batch Update Status | Change status for all selected tickets |
| Batch Assign | Reassign to a different analyst |
| Batch Delete | Soft-delete selected tickets (records retained for audit) |
Workflows (SOAR)
The Workflows module is the SOAR engine that automates repetitive tasks, orchestrates multi-step response procedures, and integrates with external tools.
Navigation: Settings → Workflows
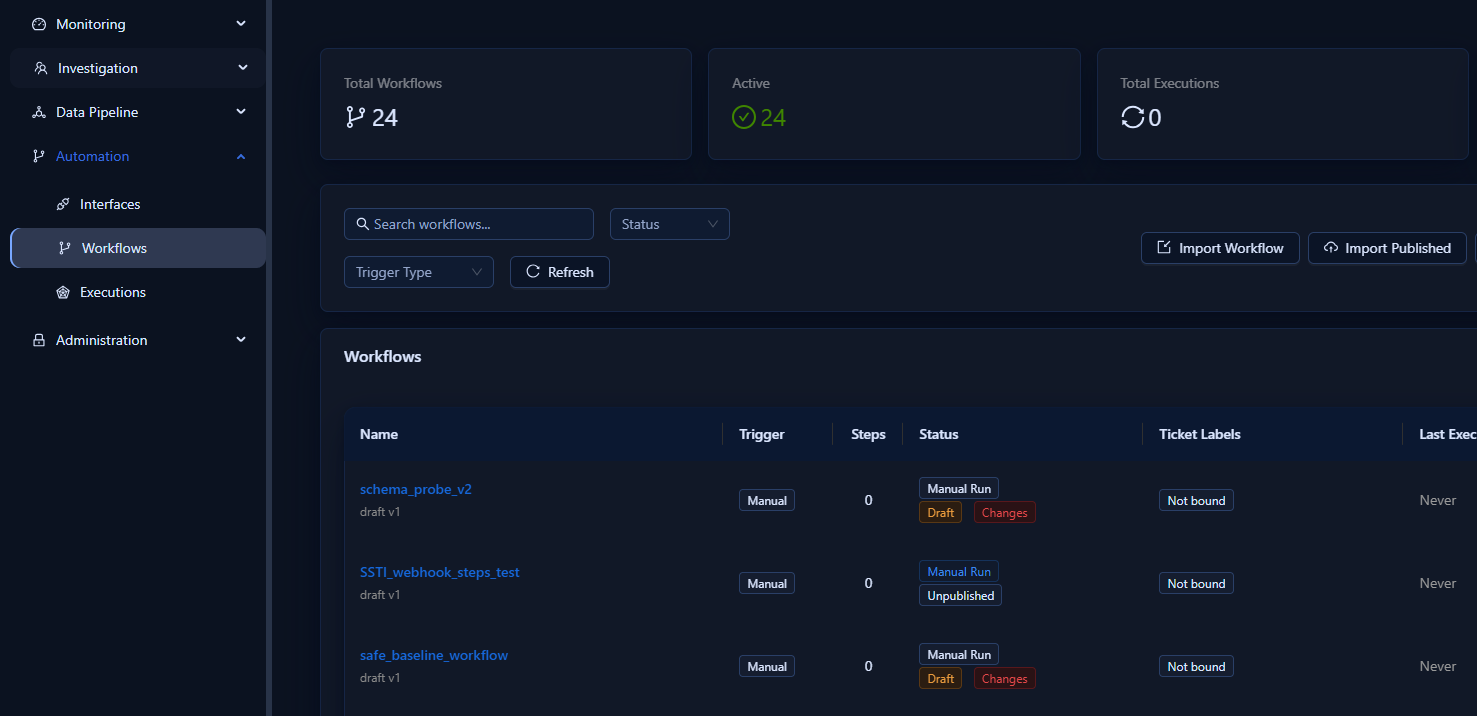
Workflow List View
Four summary cards at the top show: Total Workflows, Active, Total Executions, Success Rate.
Table Columns
| Column | Description |
|---|---|
| Name | Workflow name with version (draft v# / published v#) |
| Trigger | Trigger type tag |
| Steps | Step count |
| Status | Run status + lifecycle tags (Draft, Published, Changes) |
| Ticket Labels | Bound label filters |
| Last Execution | Status and timestamp of most recent run |
| Executions | Total execution count |
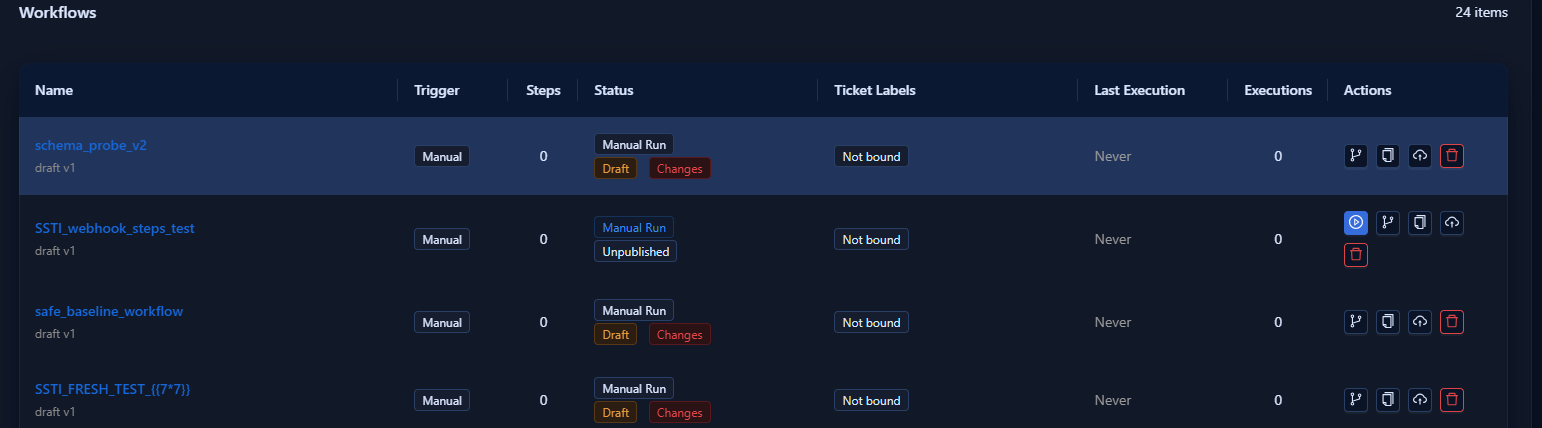
Quick Actions
| Button | Action |
|---|---|
| ▶ Execute | Manually trigger (active workflows only) |
| ⏸ Stop | Cancel a running execution |
| 🔀 Visual Editor | Open drag-and-drop editor |
| 📋 Clone | Duplicate the workflow |
| ☁ Publish | Publish manifest to Prefect |
| 🗑 Delete | Delete with confirmation |
Visual Workflow Editor
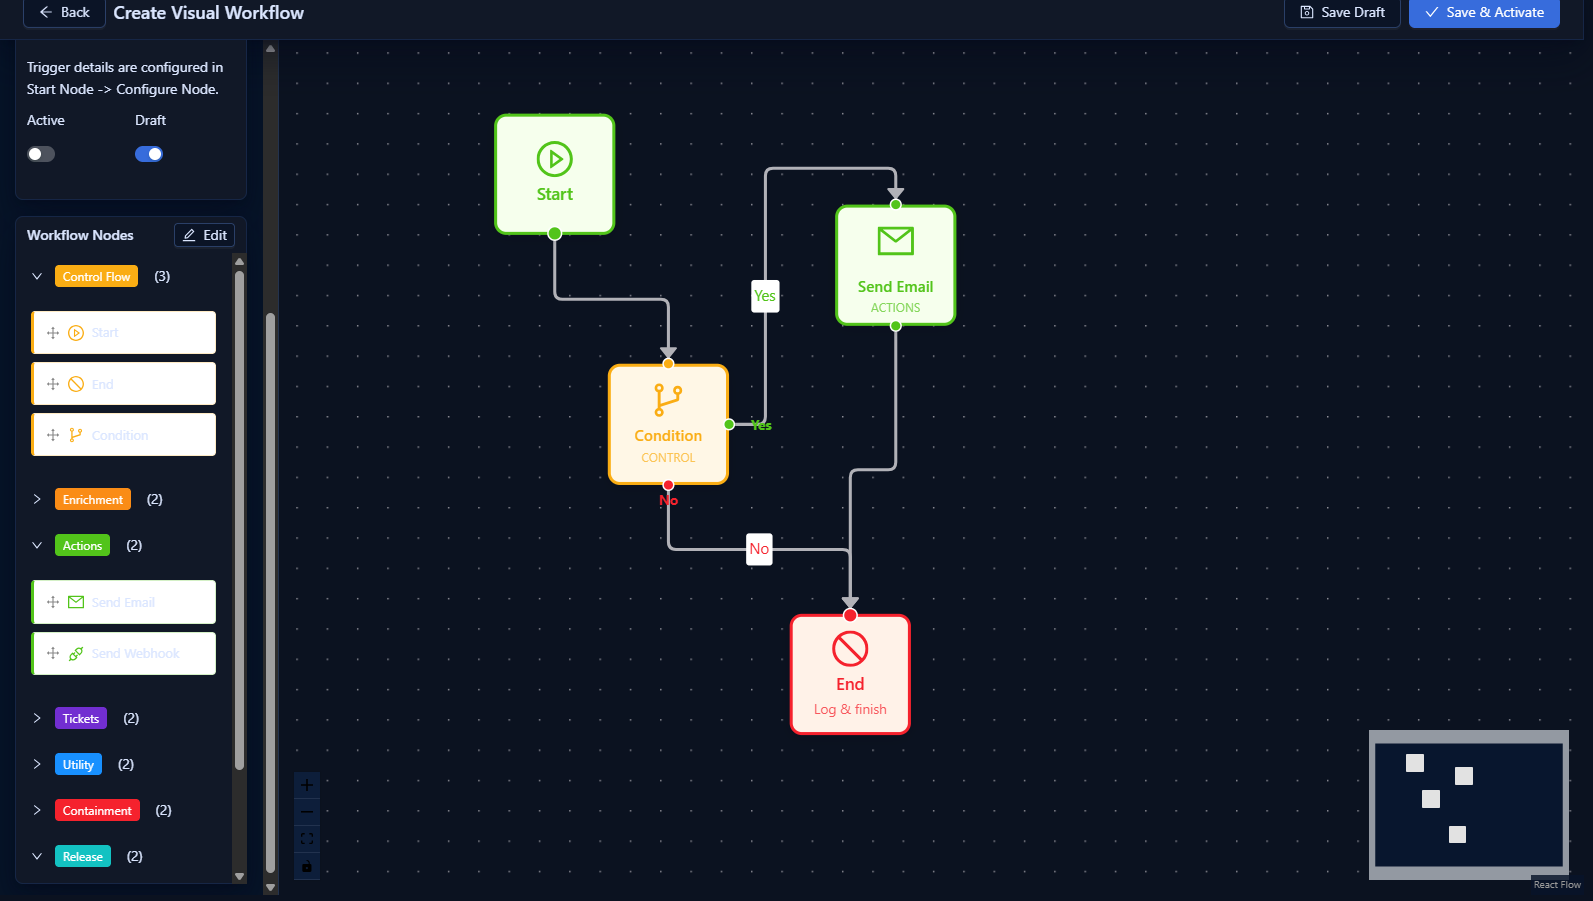
Click Create Visual Workflow or the branch icon on an existing workflow.
Editor Layout
| Area | Description |
|---|---|
| Left Panel | Action palette grouped by category |
| Center Canvas | Drag-and-drop node workspace |
| Right Panel | Node configuration (visible when a node is selected) |
| Top Bar | Workflow name, trigger settings, save/back |
Building a Workflow
- Set the workflow name.
- Select the trigger type.
- Drag action nodes from the palette onto the canvas.
- Connect nodes by dragging from one handle to another.
- Click each node and fill in its configuration in the right panel.
- Click Save to persist as a draft.
Node Types
| Type | Description |
|---|---|
| Start | Entry point |
| End | Exit point |
| Action | Executes a specific action (Block IP, Send Email, etc.) |
| Condition | Evaluates a condition; branches into True/False paths |
Trigger Types
| Trigger | Description | Config |
|---|---|---|
| Manual | Executed on demand | None required |
| On Alert Created | Fires on new alert ingestion | JSON filter conditions |
| On Ticket Created | Fires on new ticket creation | JSON filter conditions |
| On Ticket Status Change | Fires on status transition | JSON filter conditions |
| Scheduled | Recurring schedule | Cron expression |
| Webhook | Triggered by HTTP call | Webhook URL provided |
Filter condition example — trigger only for critical malware incidents:
{
  "priority": ["critical", "high"],
  "event_category": ["malware"]
}
Execution History
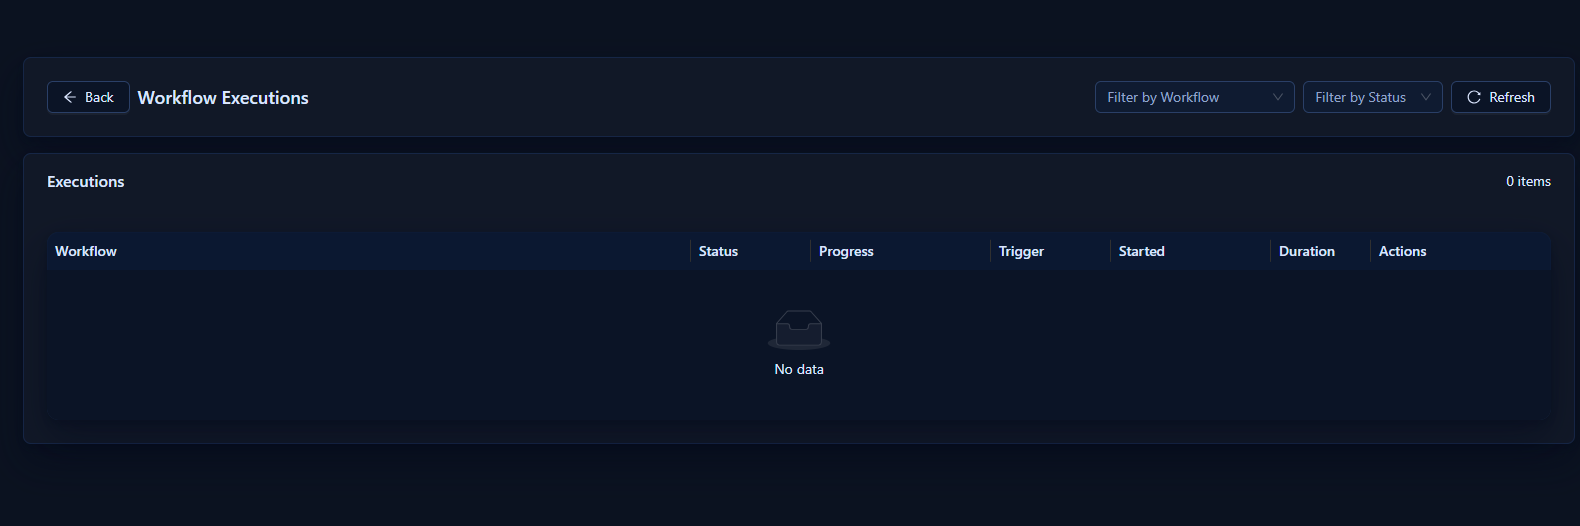
Navigate to Settings → Workflows → View Executions.
| Column | Description |
|---|---|
| Status | Pending / Running / Completed / Failed / Cancelled / Paused |
| Trigger Source | What triggered the run (manual, ticket ID, schedule) |
| Duration | Total execution time |
| Progress | Completion percentage |
Click an execution to view step-by-step timeline, error details, accumulated context variables, and full execution logs.
Cron Schedule Examples
| Expression | Meaning |
|---|---|
*/15 * * * * |
Every 15 minutes |
0 */4 * * * |
Every 4 hours |
0 8 * * 1-5 |
Weekdays at 08:00 |
0 0 * * * |
Daily at midnight |
Ticket-Workflow Bindings
Bindings trigger workflows automatically based on ticket labels:
- Configure label filters on the workflow (name + value pairs).
- Choose logic: AND (all labels must match) or OR (any label may match).
When a ticket event occurs, the system evaluates all active bindings and dispatches matching workflows with the ticket as trigger context.
Invoking Playbooks from Tickets
Workflows with Is Callable from Ticket enabled can be invoked directly from a ticket.
Method 1 — @playbook command:
In the comment box, type @ and select a playbook from the dropdown, then click Send.
Method 2 — Playbook panel: Open the ticket detail, navigate to the playbook section, and click Invoke.
Each ticket shows a Workplan listing all associated workflow executions with status, progress, and timestamps.