Data Onboarding
Data Onboarding covers the end-to-end pipeline for connecting an external data source, scheduling alert collection, and configuring correlation to convert raw alerts into incident tickets automatically.
Data Flow Architecture
Elasticsearch (external)
        │
        ▼  [Data Pipeline → Integrations]
   ELK Connector (credentials + index mapping)
        │
        ▼  [Data Pipeline → Orchestrator]
   Scheduled collection task (Cron Job)
   es_to_db: writes ES data into the internal database
        │
        ▼  [Data Pipeline → Correlation]
   Correlation engine (time window + ordering)
        │
        ▼  [Monitor]
   Overview dashboard + Alerts list
How it works:
- The Orchestrator periodically pulls alerts from the configured ES index (default every 60 minutes) and writes them to the internal
alerts_alerttable. - The Correlation engine groups alerts within a time window and applies ordering rules to generate correlated activity records and tickets.
- The Monitor module reads from the internal database to display real-time dashboard statistics and the Alerts list.
Step 1: Login
Open your browser and navigate to https://siem.seclink.info. Enter your administrator credentials and log in.
After login, the system defaults to the Dashboard Overview page. If no data source is configured, all statistics show zero.
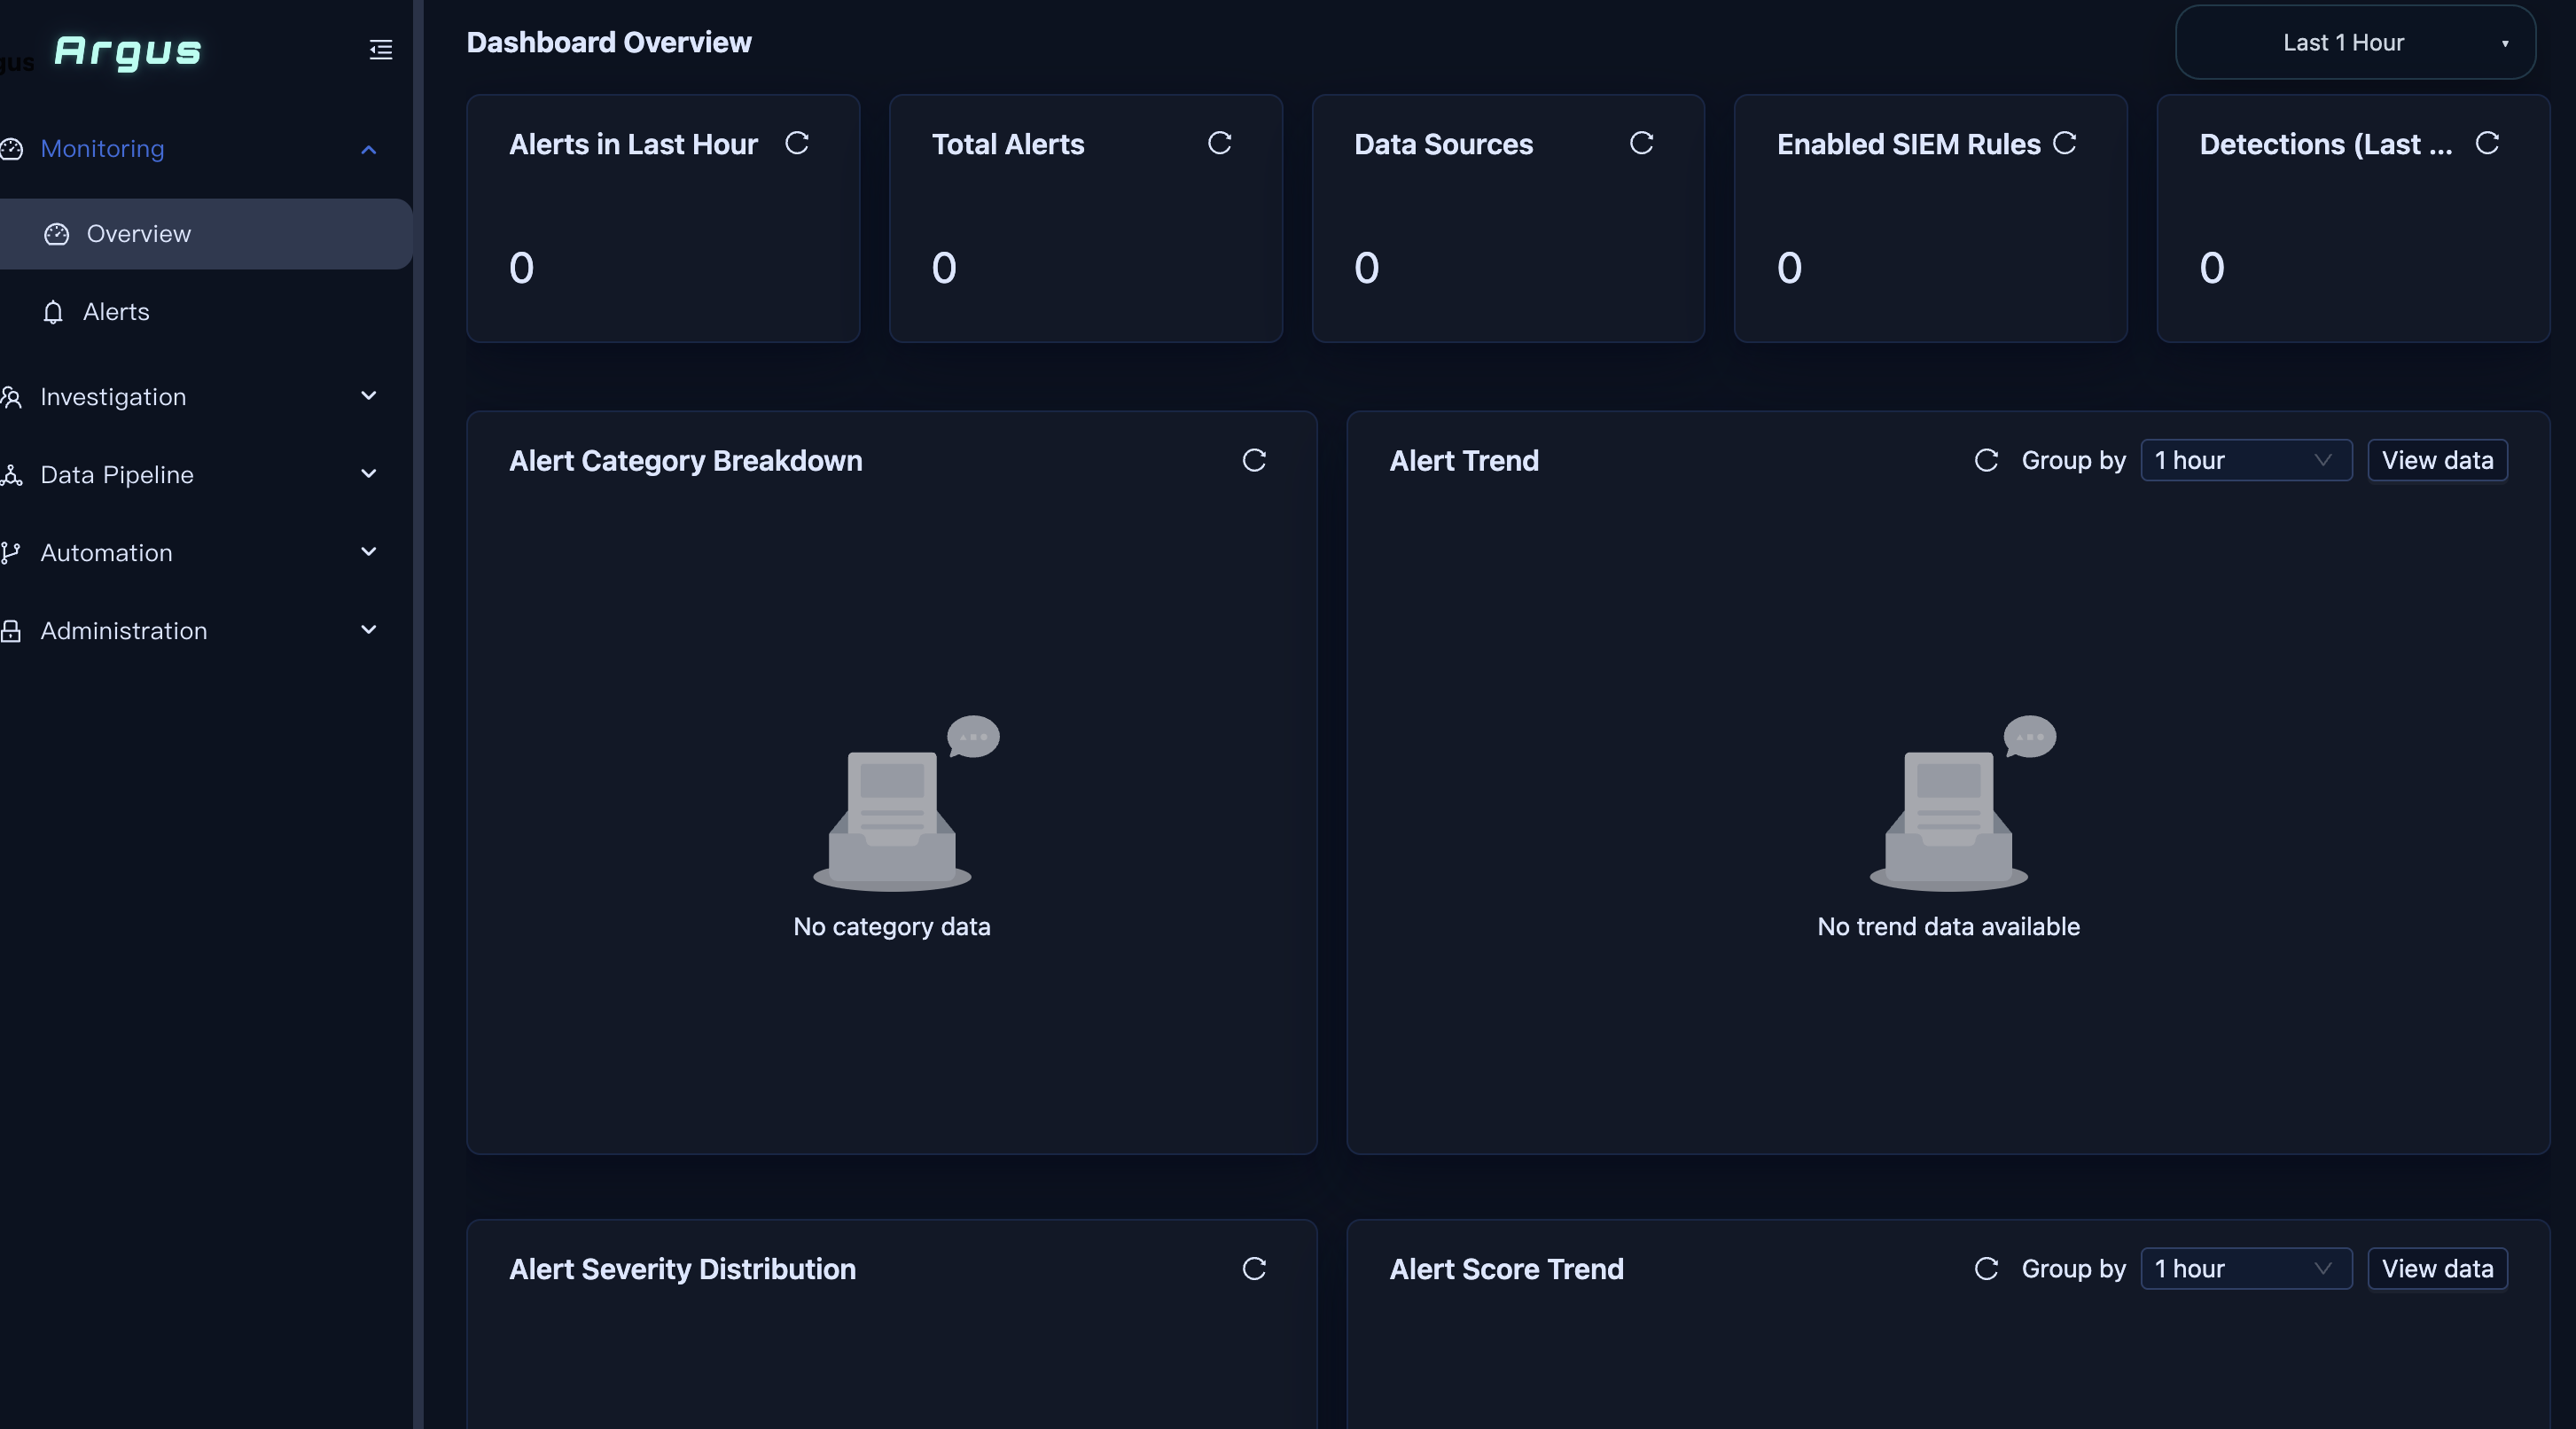
Dashboard statistics explained:
- Alerts in… — recent alert counts by time window
- Total Alerts — cumulative ingested alert count
- Data Sources — number of configured integrations
Step 2: Configure the Elasticsearch Integration
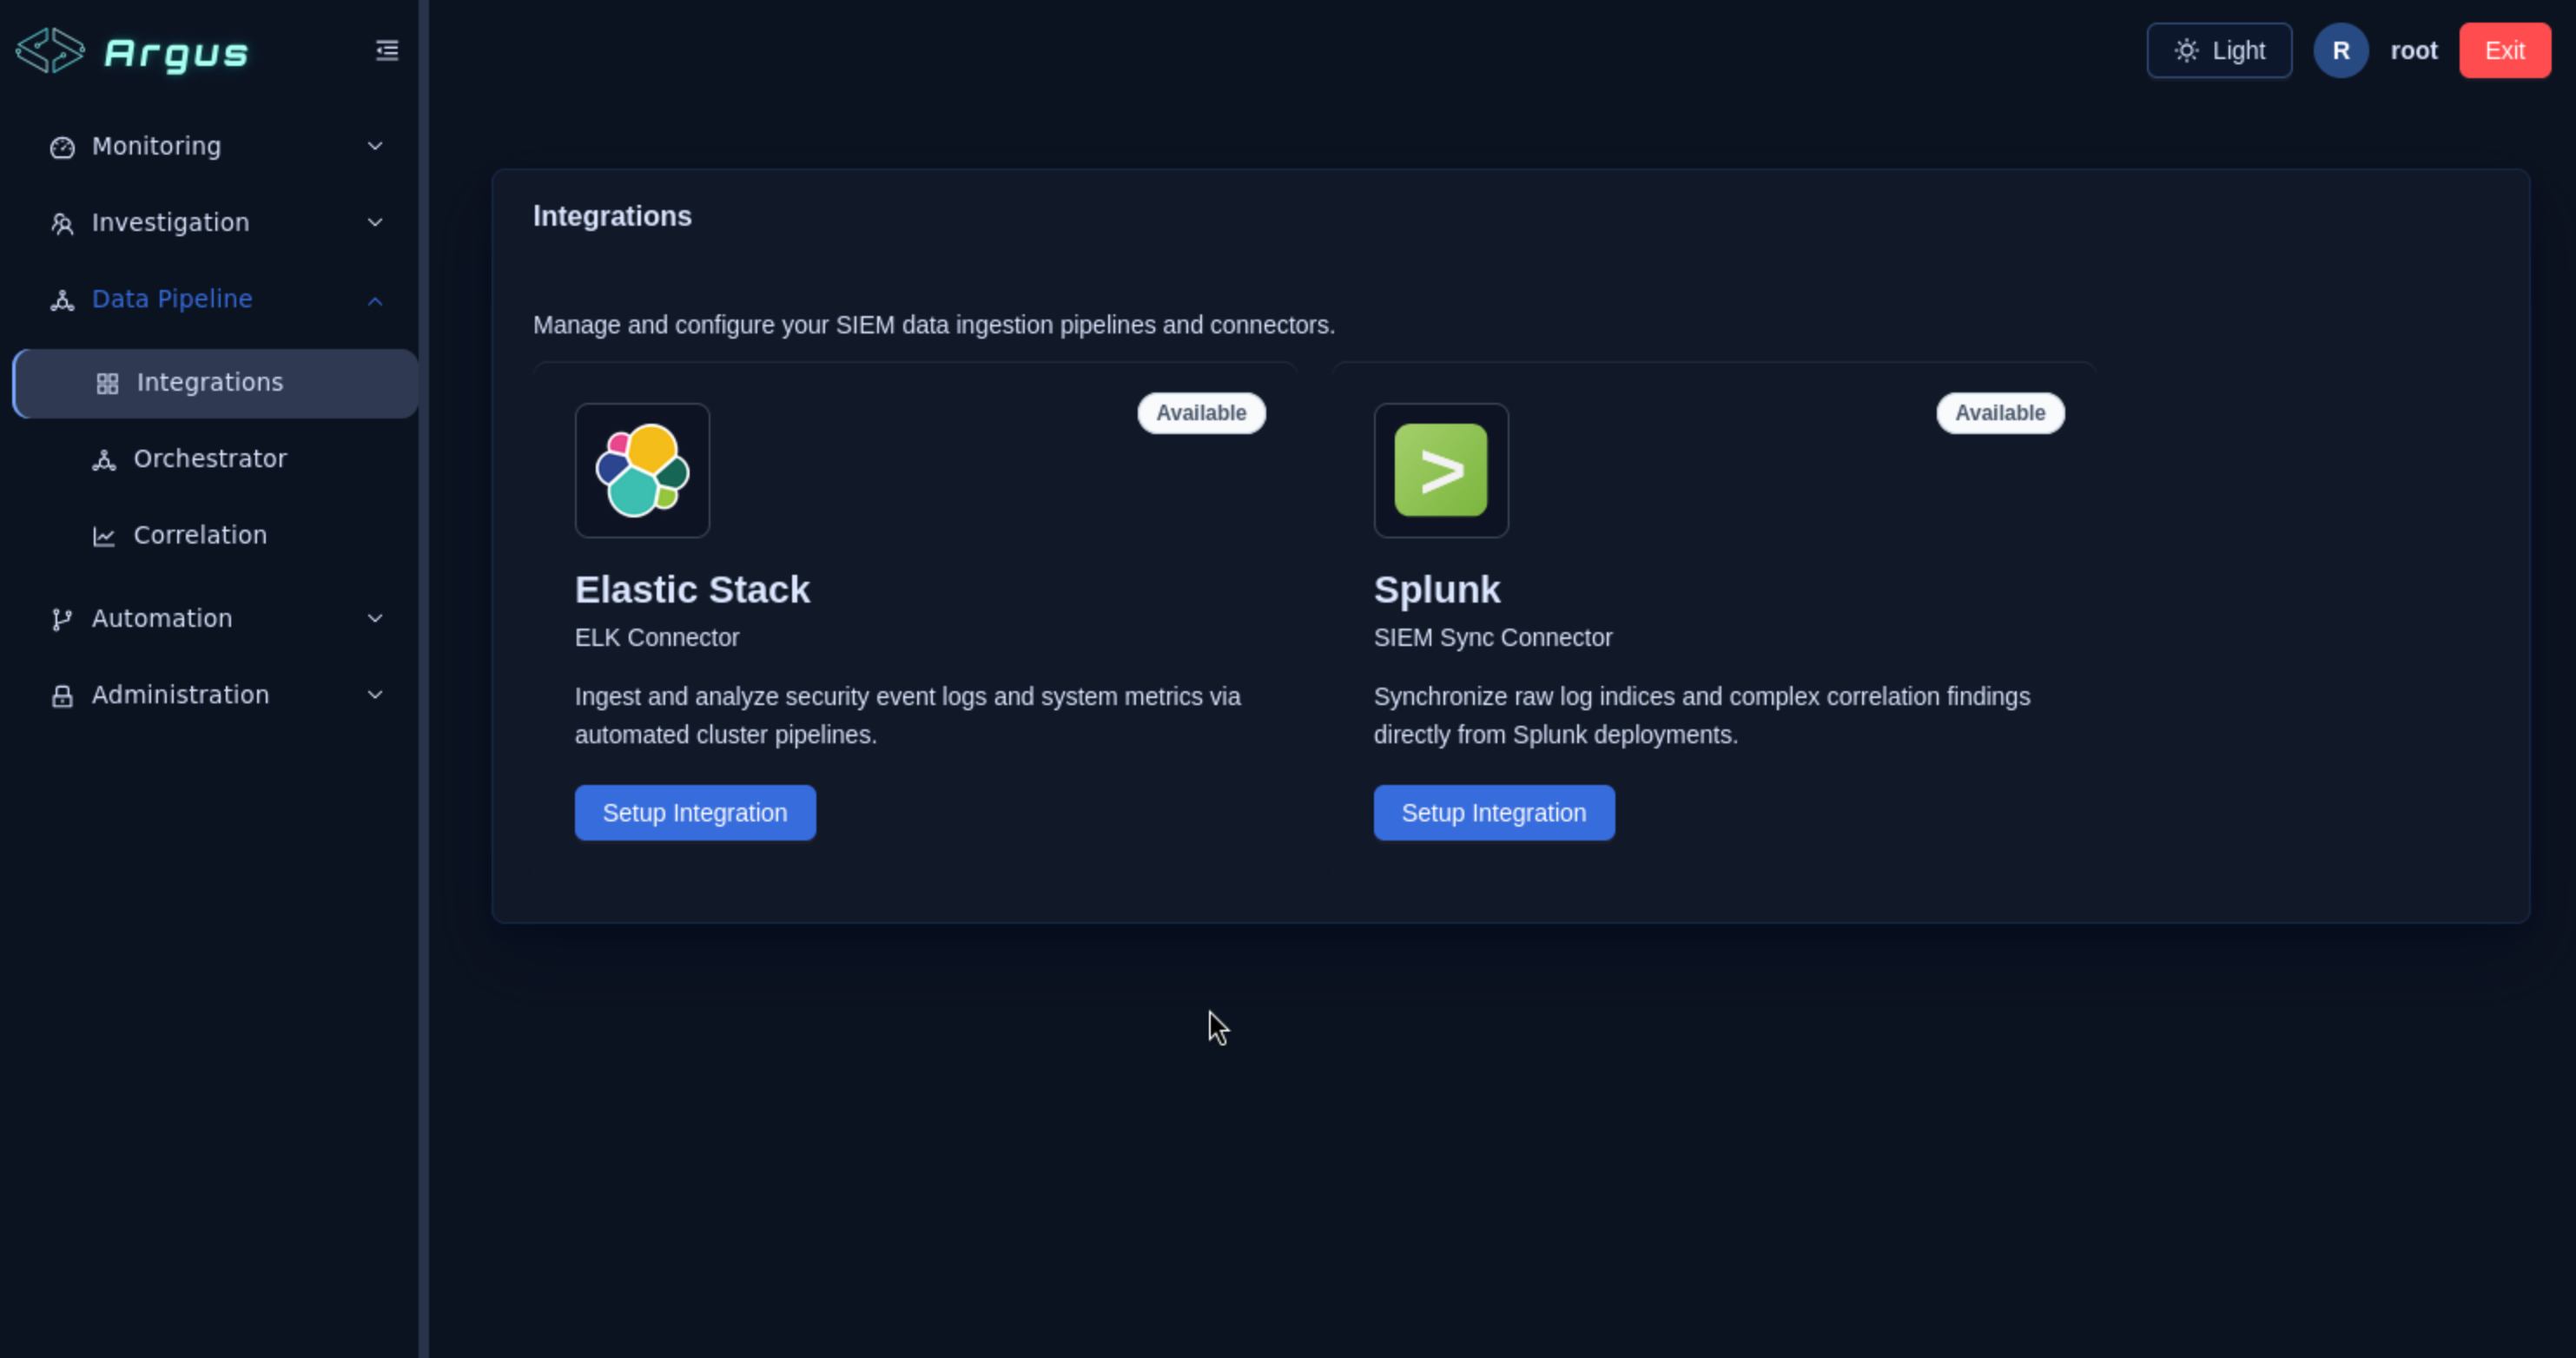
Navigation: Data Pipeline → Integrations
The Integrations page lists all available data connectors. Locate Elastic Stack (ELK Connector) and click Setup Integration.
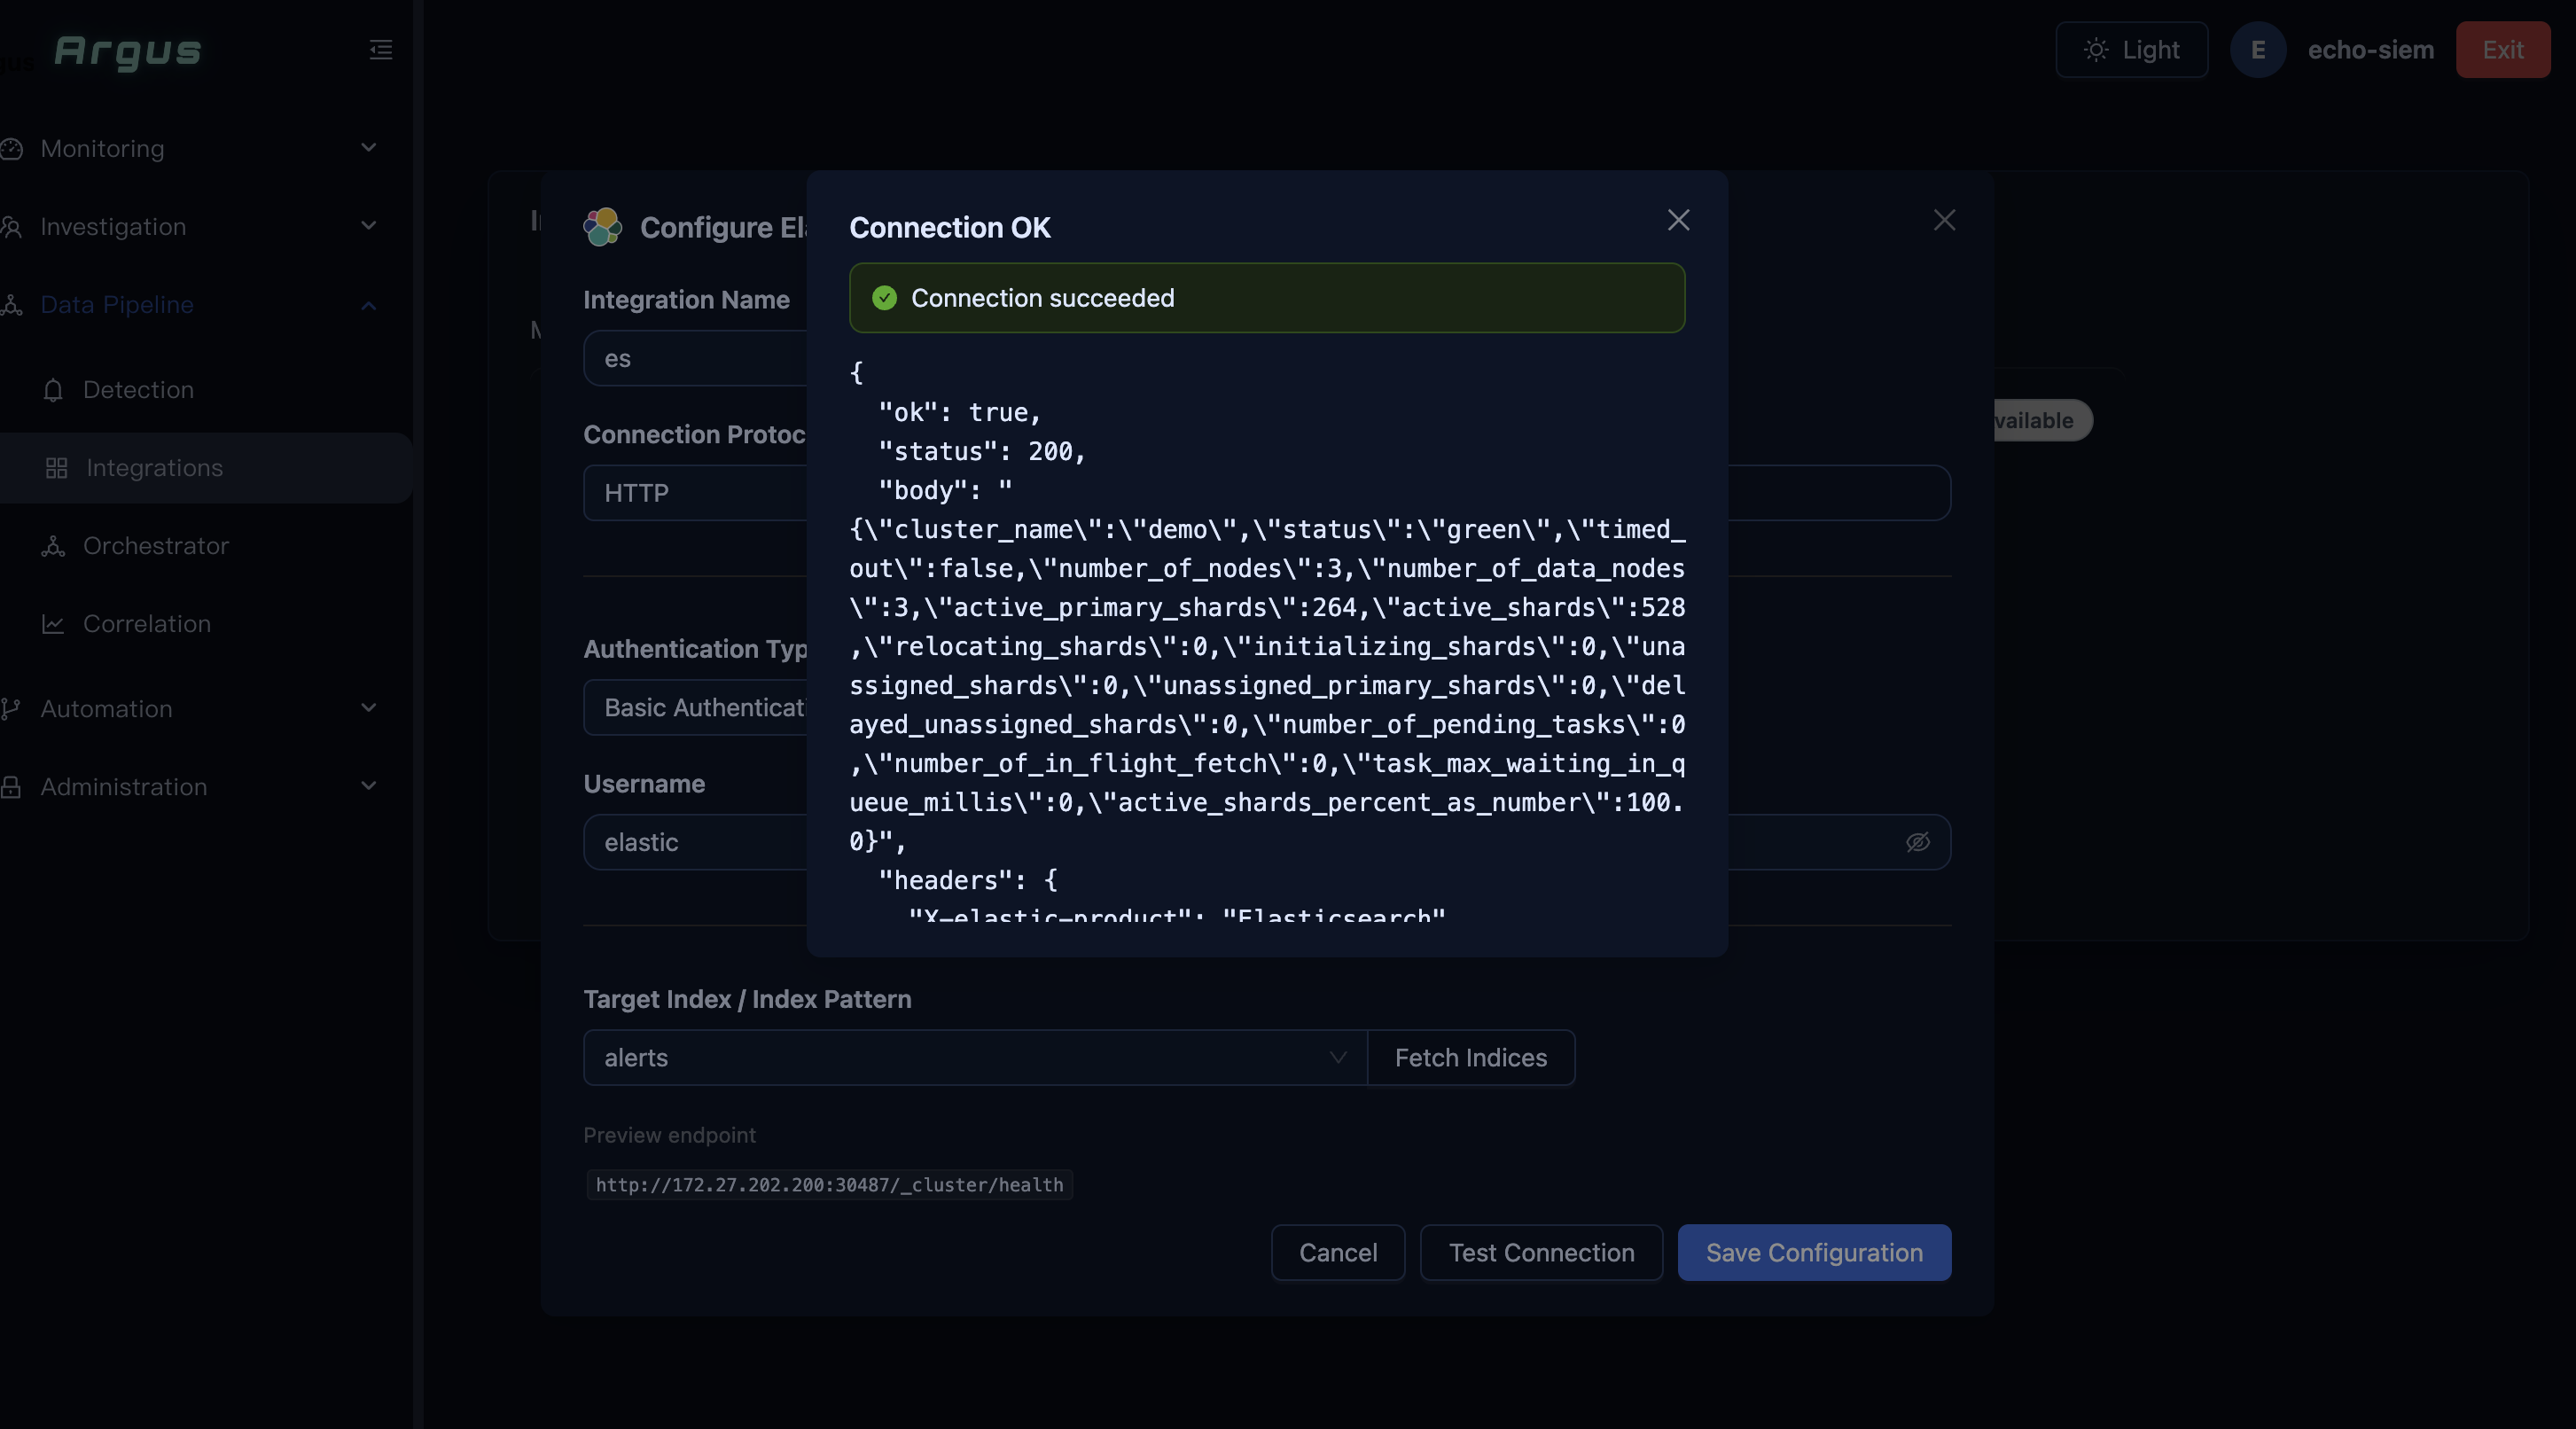
Fill in Connection Parameters
In the Configure Elasticsearch dialog, complete the following fields:
| Field | Value | Notes |
|---|---|---|
| Integration Name | Elastic Stack (ELK) |
Customizable |
| Connection Protocol | HTTP or HTTPS |
Match your ES cluster protocol |
| Host | <ES host IP> |
Without protocol prefix |
| Port | 9200 |
Default ES port |
| Authentication Type | Basic Authentication |
Or select API Key if applicable |
| Username | <ES username> |
Basic Auth credentials |
| Password | <ES password> |
Basic Auth credentials |
| Target Index / Index Pattern | alerts |
The ES index to ingest from |
Tip: After entering Host and authentication details, click Fetch Indices to auto-populate the index dropdown from your live ES cluster.
Security: The ES username and password are sensitive credentials. Do not record them in screenshots, documents, or chat messages.
Step 3: Test Connection and Save
Test the Connection
Click Test Connection. On success, the dialog shows “Connection OK” and “Connection succeeded” with ES cluster health information (status 200, cluster name, node count).
If the test fails, check:
- Host and Port are correct
- Network connectivity from the platform server to the ES cluster
- Credentials are valid
- The ES cluster is running and healthy
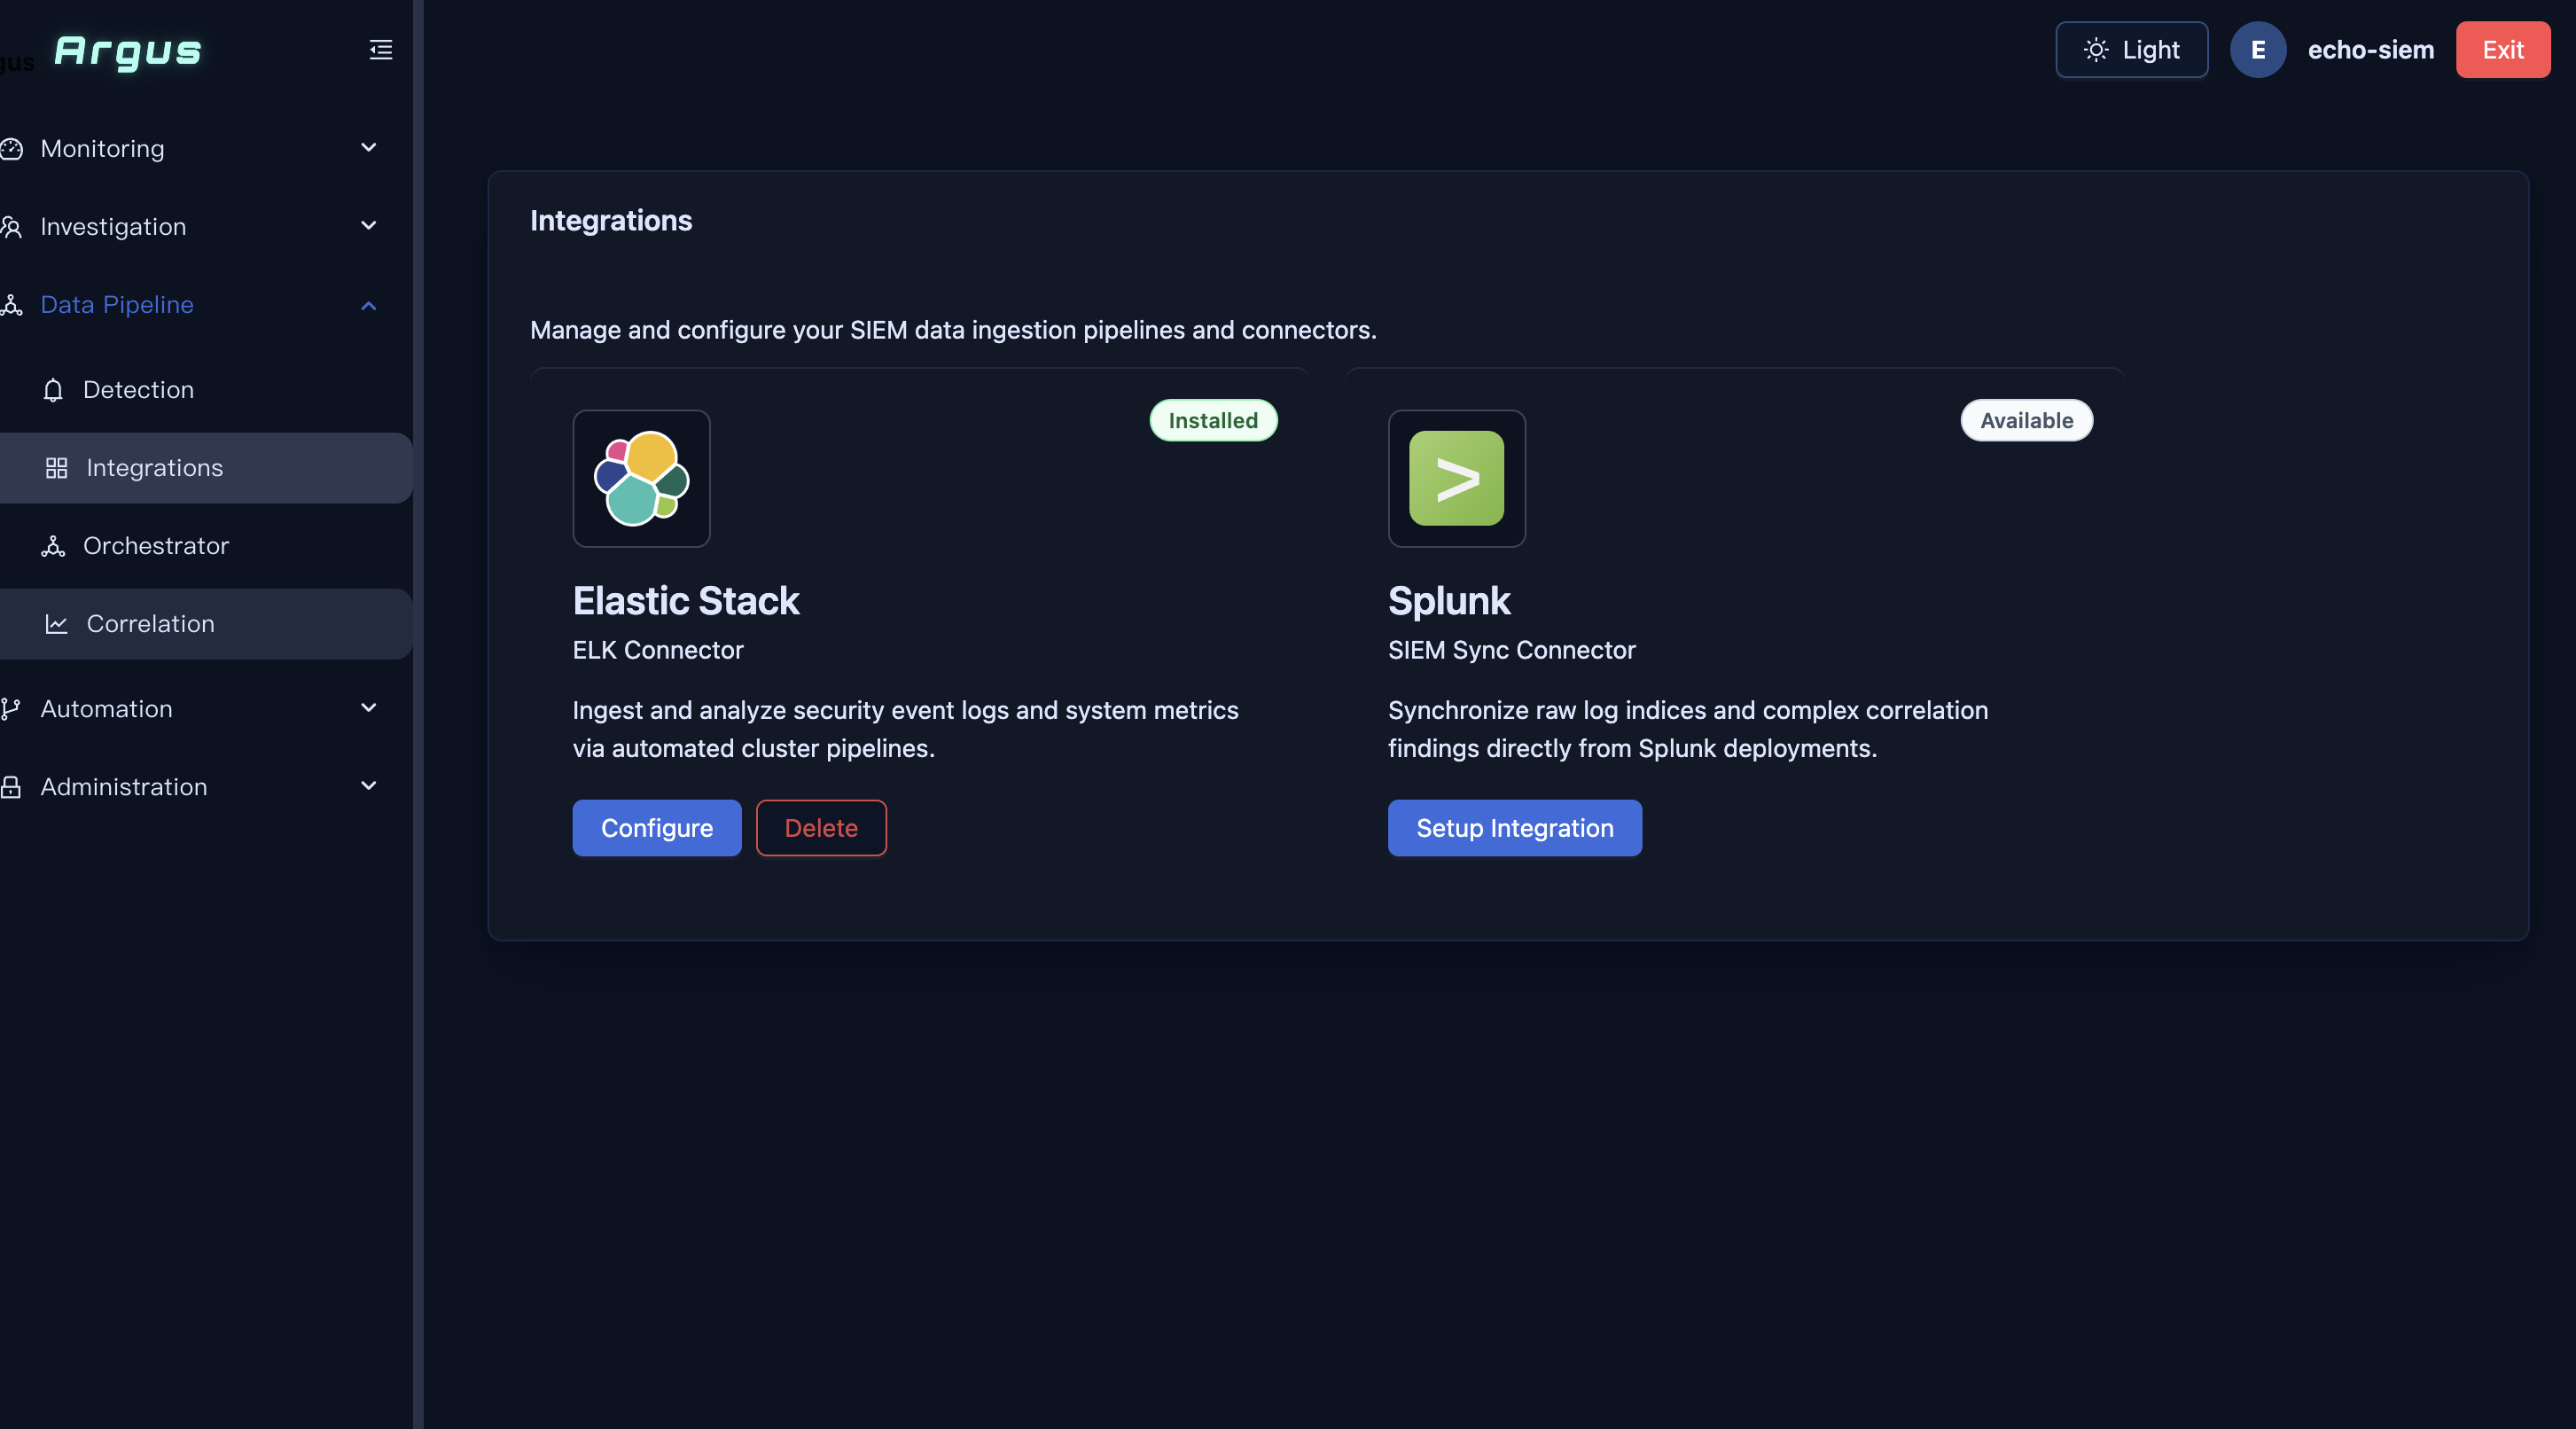
Save the Configuration
Click Save Configuration. The Integrations page will show the Elastic Stack card as Installed, with Configure and Delete buttons.
Step 4: Configure the Orchestrator (Data Collection Schedule)
Navigation: Data Pipeline → Orchestrator
The Orchestrator manages scheduled data collection tasks. Click New Task.
New Task Parameters
| Field | Value | Notes |
|---|---|---|
| Name | job |
Descriptive task name |
| Cron | */60 * * * * |
Every 60 minutes (adjust as needed) |
| Source Integration (Elasticsearch) | Elastic Stack (ELK) |
Select the integration from Step 2 |
| Index (Elasticsearch) | alerts |
Source ES index |
| Timestamp field | date |
ES document field used for incremental collection |
| Time range | (leave blank or set as needed) | Restricts collection to a time window |
| Destination Integration (Database) | Current DB (Django default) |
Write to internal database |
| Destination table | alerts_alert |
Auto-populated |
| Limit | 1000 |
Max alerts per run |
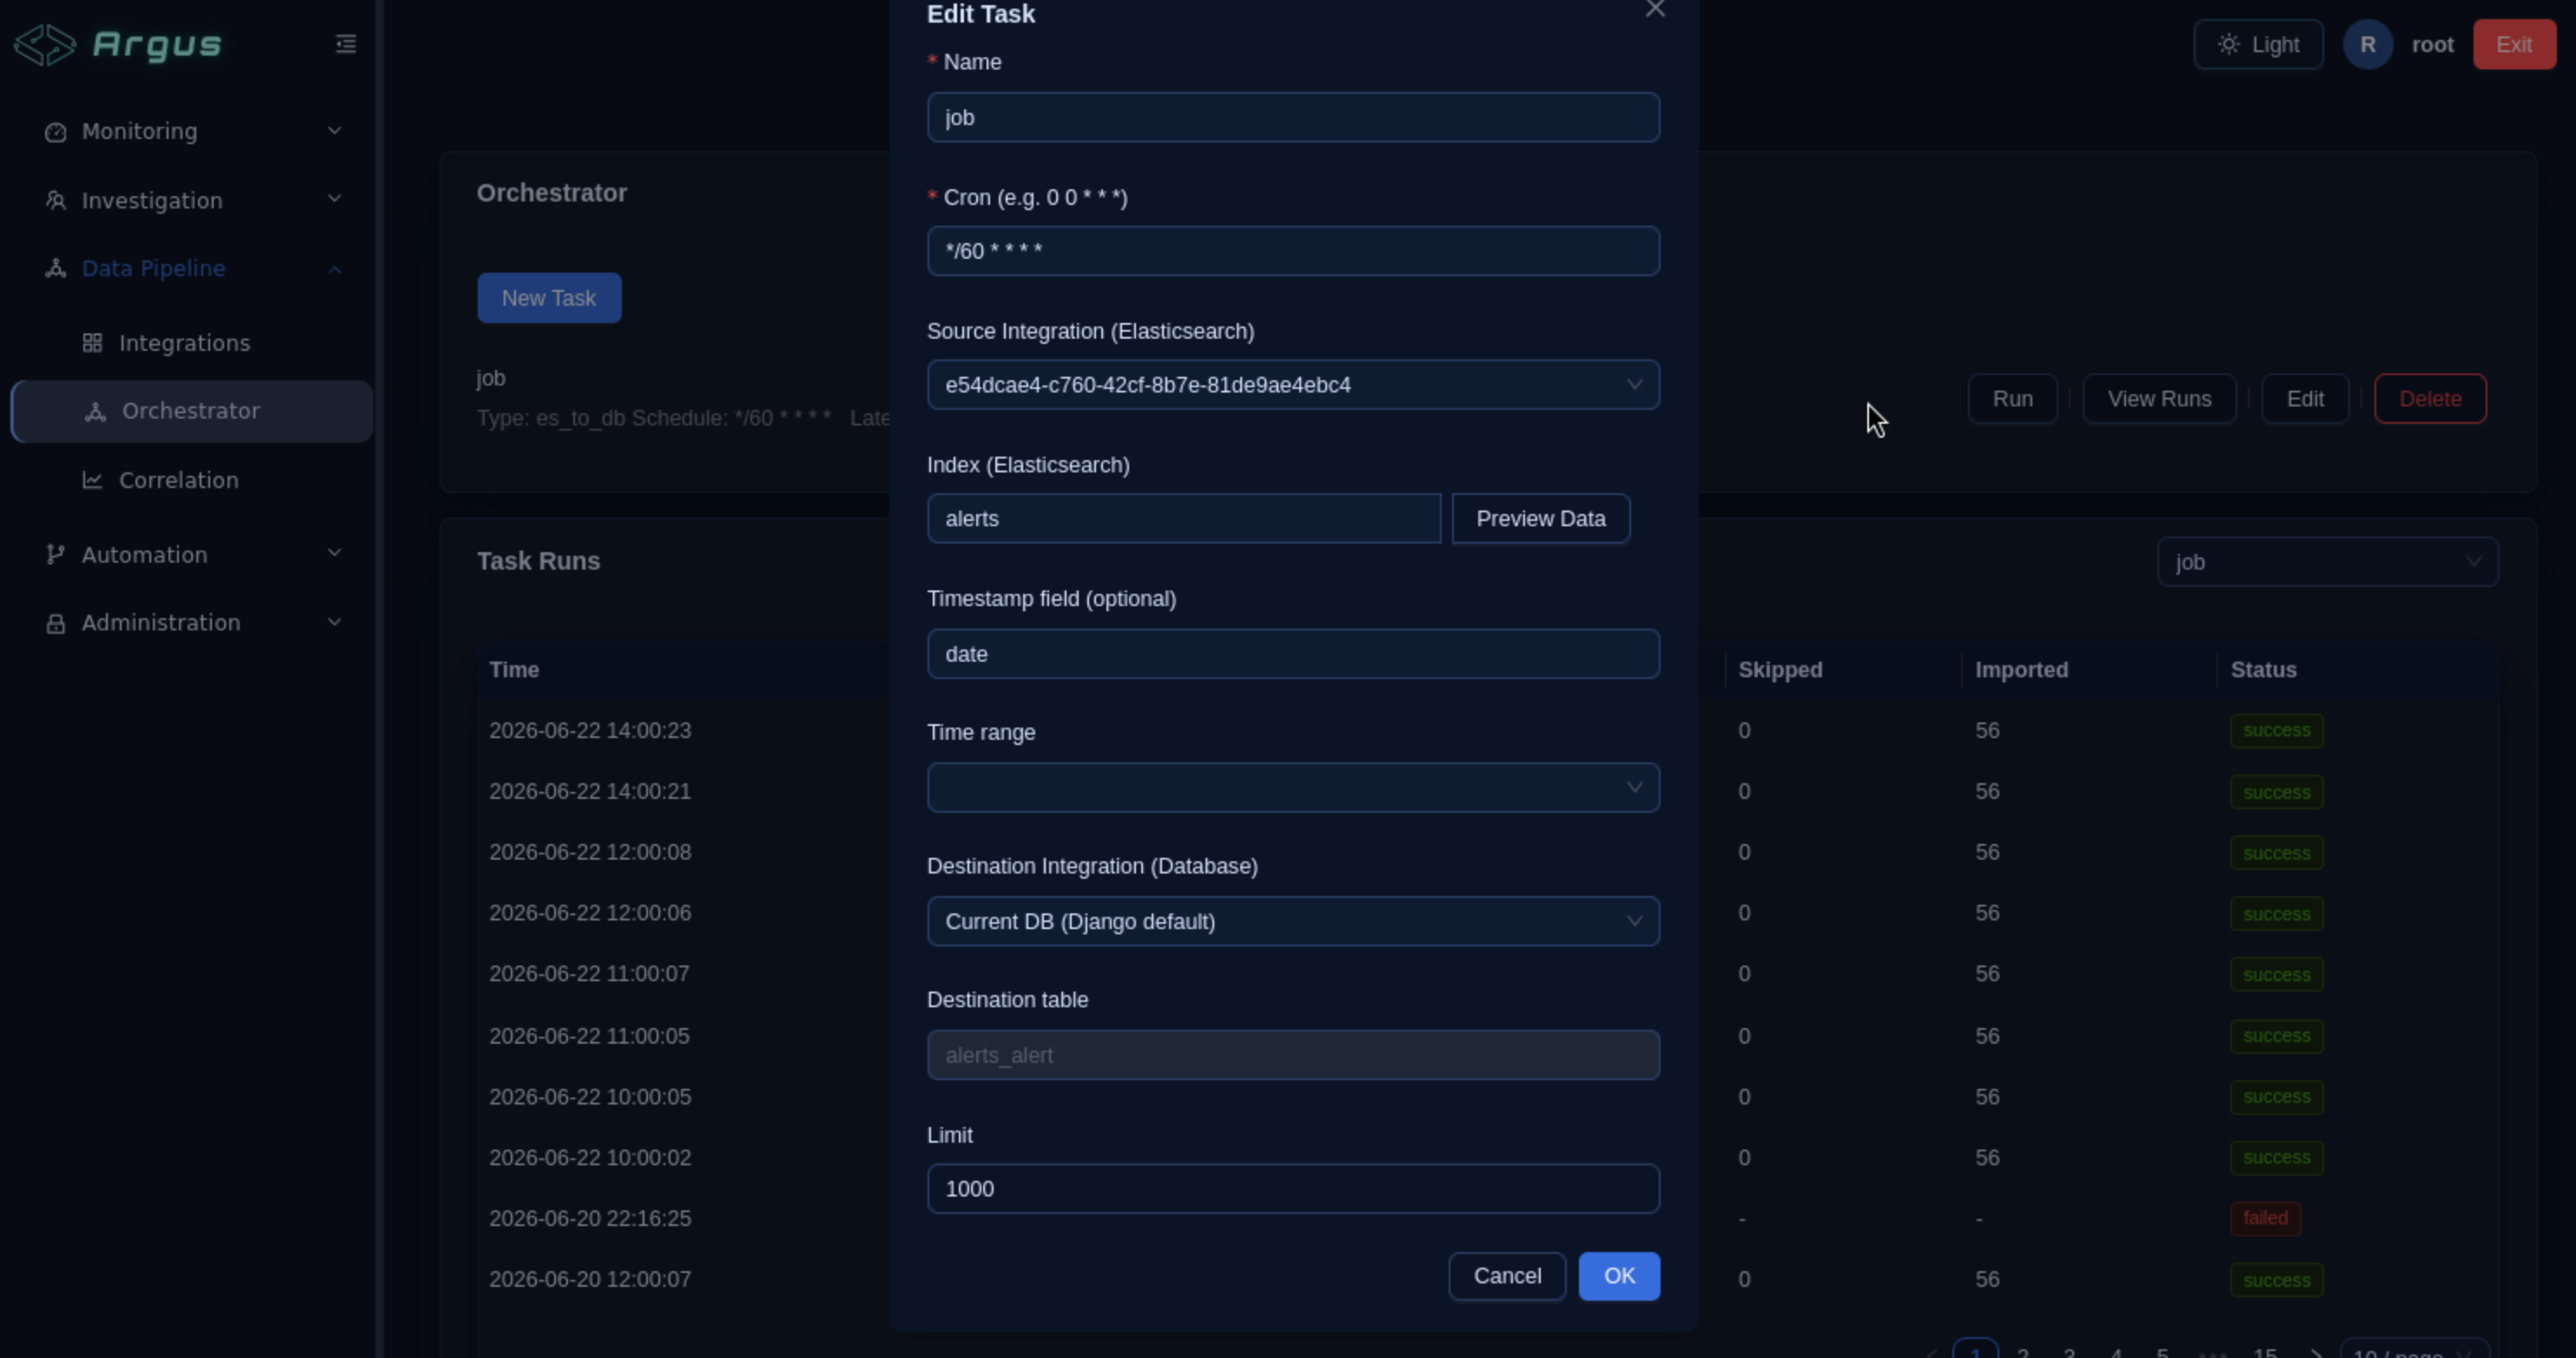
Click OK to save the task.
Cron Expression Reference
| Expression | Schedule |
|---|---|
*/60 * * * * |
Every 60 minutes |
*/5 * * * * |
Every 5 minutes |
* * * * * |
Every minute |
0 * * * * |
Every hour on the hour |
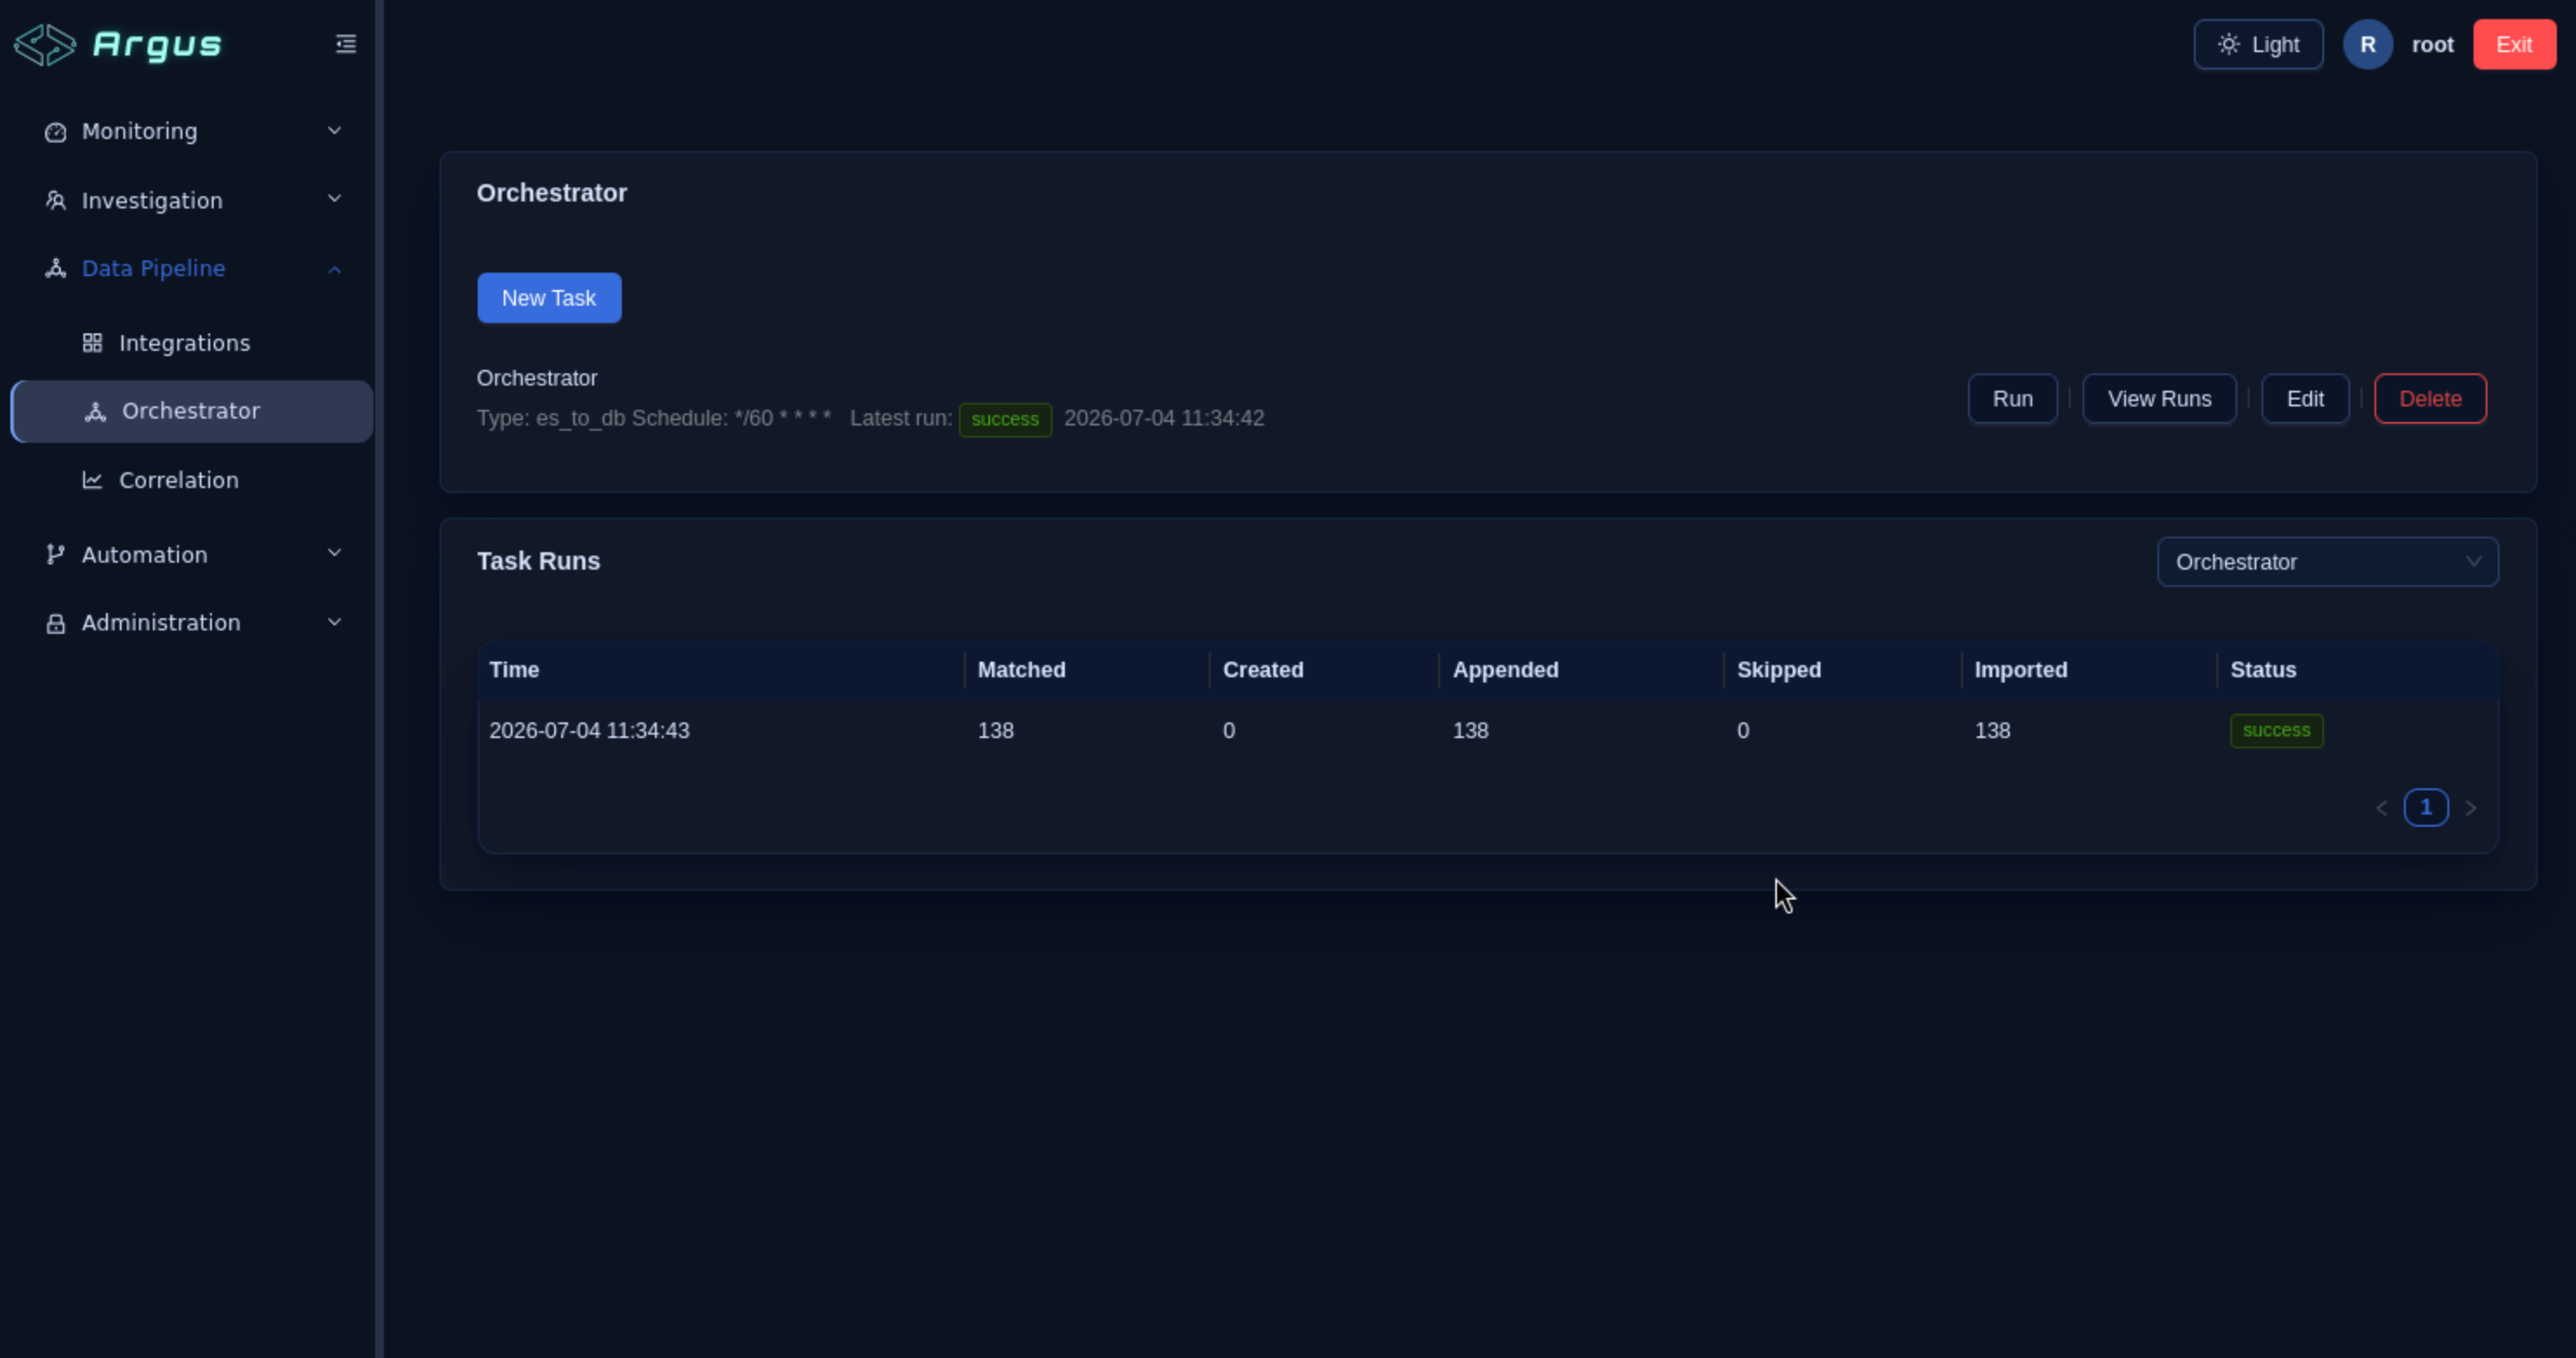
Manual run: Click Run on the task to trigger an immediate collection run. Click View Runs to check run history and import statistics.
Step 5: Configure Correlation Policy
Navigation: Data Pipeline → Correlation
The Correlation engine groups related alerts into incident records based on a time window and ordering fields.
Correlation Policy Settings
| Field | Recommended Value | Notes |
|---|---|---|
| Enabled | On | Must be enabled to generate tickets from alerts |
| Window (minutes) | 30 |
Alerts within a 30-minute window are considered related |
| Order By Fields | severity (desc), timestamp (asc) |
Determines alert ordering within the correlation window |
| Auto-create Tickets | On | Automatically opens a ticket for each correlated group |
Important: Enabling auto-create tickets will generate a new incident ticket for each alert group that matches the correlation window. Confirm the policy settings in a test environment before activating in production.
Step 6: Verify Data Ingestion
After completing the above steps:
- Trigger a manual Orchestrator run — go to
Data Pipeline → Orchestrator, click Run on your task. - Check the Dashboard (
Monitor → Overview) — the alert counters should now show non-zero values. - Check the Alerts list (
Monitor → Alerts) — ingested alerts should appear. - Check Tickets (
Investigation → Tickets) — if Correlation auto-create is enabled, tickets should be generated from correlated alert groups.
Troubleshooting
| Issue | Check |
|---|---|
| Test Connection fails | Host/Port correct? Network accessible? Credentials valid? ES cluster running? |
| No alerts after Orchestrator run | Is the target index name correct? Does the timestamp field exist in documents? |
| Duplicate alerts appearing | Source document unique ID field is consistent across documents |
| Tickets not created | Is Correlation policy enabled? Is Auto-create Tickets turned on? |
| Orchestrator task not running on schedule | Check that the cron expression is valid; verify no overlapping runs are queued |